Measure Carbon Pricing by the Emissions It Cuts
The Total Effective Carbon Price: one carbon-tax equivalent for any mix of taxes, subsidies and standards
Countries cut emissions with taxes, subsidies, standards and mandates, yet the usual carbon-price measures add up explicit prices per tonne. A fuel standard or a revenue-neutral feebate scores zero, and a dollar on coal counts the same as a dollar on gasoline. The Total Effective Carbon Price is the single economy-wide carbon tax that would cut emissions as much as the actual policy mix. It can be computed from an energy balance, fuel prices and published elasticities. In a stylized economy it rates a mix at $37 per tonne in the long run and $28 after one year, where explicit prices show $21. Crediting, border recognition and country reviews can all use it.
carbon pricing, effective carbon price, carbon-price equivalent, non-price instruments, policy crediting, CBAM
Climate Fiscal Policy Brief No. 6.1, October 2026. Stephen J. Stretton, writing in a personal capacity. The views expressed are the author’s own and do not represent those of any institution with which he is or has been affiliated. The full analysis, with the model, proofs, calibration and literature, is in the working paper.
Key messages
Read the full working paper → · Download this brief (pdf) · Slides (pdf)
Headline carbon prices miss most climate policy. They add up explicit prices per tonne, so a fuel standard, a clean-power subsidy or a revenue-neutral feebate scores nothing, and a dollar on coal counts the same as a dollar on gasoline.
Measure a policy mix by the carbon tax it is worth. The Total Effective Carbon Price (TECP) is the uniform, economy-wide carbon tax that would cut emissions as much as the actual mix. A ministry can compute it from data it already holds.
The difference is large. In a stylized economy, a mix that explicit prices rate at $21 per tonne is worth $37 in the long run ($32–38 across the evidence on elasticities) and $28 after one year.
Standards and mandates fit on the same scale. A tradable standard counts at its credit price, weighted by how much it cuts; a mandate counts through its measured effect.
Use it to pay for policies, to credit non-price policies at the border and to show governments where their mix is weak. Report it beside each instrument’s cost, never instead of it.
Headline prices measure the signal, not the result
No country prices carbon with one instrument. A typical package combines a carbon tax or emissions trading in power and industry, fuel taxes, subsidies for renewable power, a clean-fuel standard and efficiency rules. Comparing countries’ effort, paying a country for a policy or crediting its carbon pricing at a foreign border all need one number per tonne that treats a tax, a subsidy and a standard alike.
The standard measures add up prices. The OECD’s effective carbon rate adds carbon taxes, emissions trading prices and fuel taxes per tonne of CO₂ (OECD 2023). The World Bank’s total carbon price adds direct carbon pricing to indirect pricing through fuel taxes net of fuel subsidies, so it can turn negative, and weights by emissions (Agnolucci et al. 2024). Its authors state the limit: the measure describes the incentive, not the emission cuts it produces, and a version weighted by effectiveness is left for future work (Agnolucci et al. 2024).
Adding prices fails in three ways. First, it weights each price by emissions, not by how much emissions respond. A $1 tax raises the cost of coal power by 1.4 percent but the price of gasoline by 0.2 percent, so the coal tonne responds far more. Second, instruments without a per-tonne rate score zero: a renewable subsidy, a clean-fuel standard, a procurement rule, and a revenue-neutral feebate, whose average payment is nil (Brief 1.2). Third, it cannot see how an instrument works: a feebate pushes producers to switch to cleaner fuels and leaves demand almost untouched, while a tax on energy does the reverse.
Counting standards at their credit price does not fix the problem. The comprehensive carbon price of Carhart et al. (2022) adds the credit prices of standards and feed-in tariffs to explicit prices, weighted by the emissions each covers. It shows the incentive emitters face. Its authors leave the question of what the incentives achieve for future work, and the answer can differ by a factor of two, as the example below shows.
The Total Effective Carbon Price
The TECP asks what uniform carbon tax would cut emissions as much as the actual mix. A tax of $30 per tonne on every fuel is worth exactly $30. Any other instrument, priced or not, is worth the uniform tax that matches its effect on emissions, against the same baseline and over the same horizon. The concept was proposed for comparing countries and for border adjustments by Weil (2021), and the IMF computes it for the G20 with its Climate Policy Assessment Tool (CPAT), one model run per policy (Black et al. 2022).
The working paper makes it computable without a model run. Each instrument is translated into the price changes it causes on each fuel in each sector. A standard model of energy demand then splits the response into two effects: switching to cleaner fuels, and using less energy. Weights computed once per country, from the energy balance, fuel prices and two published elasticities per sector, turn any package into one number by a weighted sum (working paper, the Total Effective Carbon Price). A short correction brings the result to within 2 percent of the full model, which gives the exact value (working paper, beyond first order).
The weights show where carbon prices bite. They are large where clean and dirty fuels compete, as in power, and where carbon is a large share of the energy bill, as with coal in industry; they are small in road transport, where fuel is expensive per tonne of carbon.
The TECP has a horizon. Switching fuels needs new boilers, vehicles and power plants and takes a decade or more; using less energy happens within a year or two. So a policy that works by switching, such as a feebate, a renewable subsidy or a fuel standard, is worth less in its first years than in the long run, relative to a tax (working paper, horizon).
Standards and mandates fit on the same scale
A tradable standard is a feebate at its credit price. A low-carbon fuel standard taxes fuels above the standard and subsidizes fuels below it (Holland et al. 2009); with credits traded, every supplier faces the credit price at the margin. It therefore enters the TECP like any price instrument. A renewable portfolio standard charges every fossil megawatt-hour the same, so it does not separate coal from gas, and the TECP shows the cost of that (working paper, non-price instruments).
A standard that cannot be traded counts at the average marginal cost of compliance, weighted by how strongly each firm responds. A simple average overstates the TECP when the firms with the highest costs are also the least able to respond, which is common.
A mandate counts through its measured effect. Rules that change technology directly, such as coal-plant retirement, low-carbon cement in public works or forward obligations on fuel suppliers (Brief 1.3), are scored by the uniform tax that would cut as much. The effect must be measured against the same baseline and must be net of leakage. When some US states limited greenhouse gases per mile of new cars inside the federal fuel-economy standard, leakage to other states offset an estimated 70–80 percent of the reductions from new cars in the adopting states (Goulder et al. 2012).
A stylized mix is worth $37, not $21
The working paper scores one policy mix in a stylized three-sector economy. The economy emits 261 million tonnes of CO₂ a year: 119 from power (coal, gas and renewables), 80 from road transport (gasoline, diesel and biofuel) and 62 from industry (coal, oil and gas). The mix has a $30 per tonne carbon tax on power and industry, a $10 per megawatt-hour subsidy for renewable power and a tradable standard that cuts the carbon intensity of road fuel by 2 percent. All numbers are stylized (working paper, worked example).
| Instrument | Explicit-price measure | Comprehensive carbon price | TECP, long run | TECP, after one year |
|---|---|---|---|---|
| Carbon tax, $30/t, power and industry | 20.8 | 20.8 | 27.2 | 25.4 |
| Renewable subsidy, $10/MWh | 0 | 0 | 4.3 | 1.2 |
| Fuel standard, −2% (credit price $166/t) | 0 | 51.1 | 1.2 | 0.8 |
| Policy mix | 20.8 | 71.8 | 36.9 (32–38) | 28.3 |
The tax is worth more than its headline, because it falls where emissions respond. The explicit-price measure spreads the $30 tax over all emissions, including the 31 percent from road transport that it does not cover. But a uniform tax gets only about 6 percent of its effect from road transport, so leaving road fuel out costs little: the tax alone is worth $27, not $21. Extending it to road fuel would add only about $1.6.
The fuel standard has a high price and a small effect. Its credit price is $166 per tonne, yet it adds only about $1 to the TECP: a high price on a large, unresponsive base. Counting its credit price as a carbon price, as the comprehensive carbon price does, puts the mix at $72.
The renewable subsidy is worth $4 in the long run and $1 after one year. It works by building new capacity, which takes time, while cheaper power raises demand at once. At $79 of budget per tonne avoided, a cost-per-tonne measure would rank it the most ambitious instrument; the TECP ranks it a distant second.
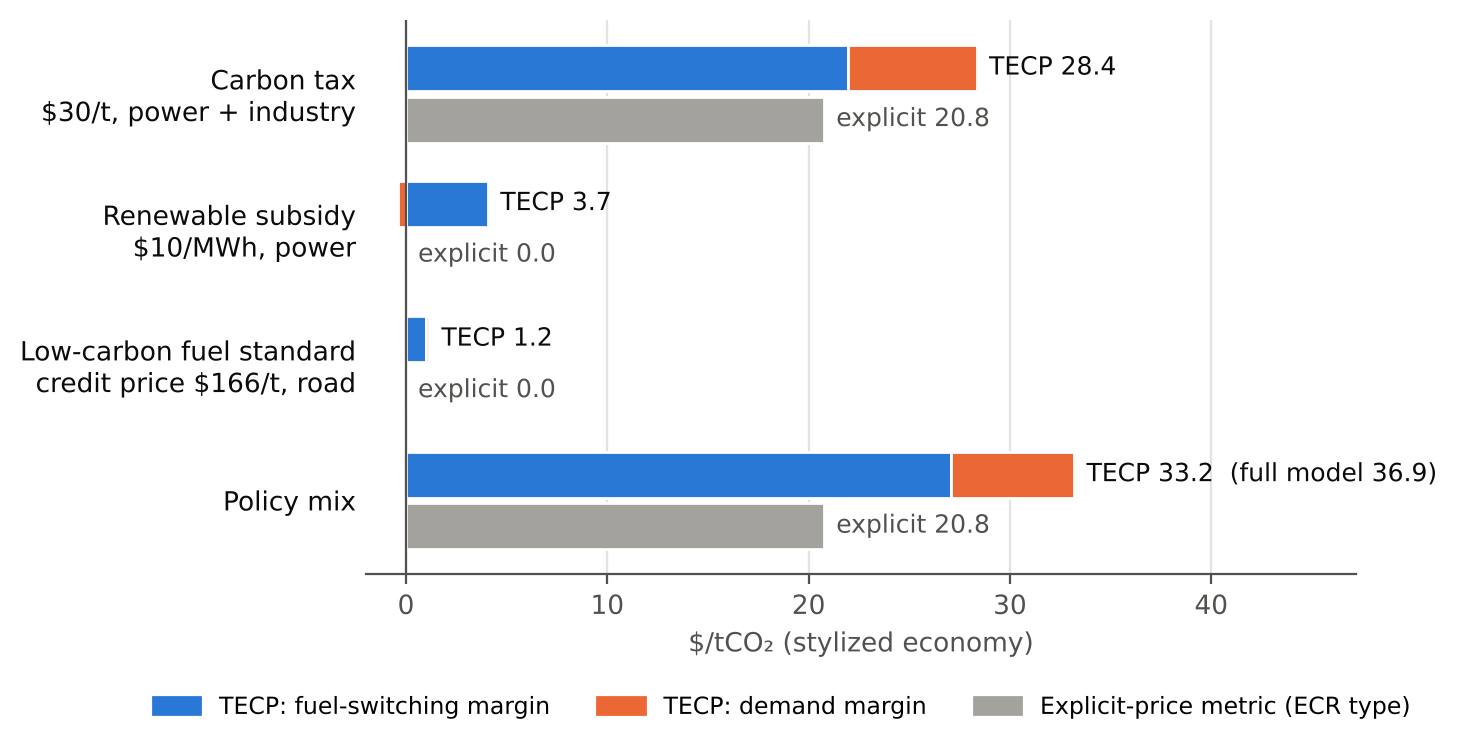
figures/make_figures.py.
The result holds across the evidence on elasticities. Drawn 2,000 times from the published ranges, the mix’s long-run TECP lies between $32 and $38 in 90 percent of draws and above $21 in every draw (working paper, calibration). Errors common to all elasticities cancel, because the TECP compares two cuts made with the same numbers. Errors in the demand elasticities alone do not: with the higher demand elasticities built into CPAT, the TECP is $33, as Brief 5.4 found (Stretton 2026a). A model that, like CPAT, applies long-run responses in the first year would also report $37 for year one, about 30 percent above the $28 that capital turnover allows.
Three uses
Climate finance can pay for policies rather than projects. A payment per tonne above half a feebate’s rate makes adopting the feebate a gain for the country (Brief 1.1). The tonnes paid for are the policy’s change in TECP times the country’s emission cut per dollar of uniform tax (working paper, uses). A country that adopts a fuel standard or a procurement rule then earns the same per tonne as one that adopts a tax. Because the TECP is a forecast, payments should be settled against observed emissions.
Border mechanisms can credit the price signal of feebates and standards. The EU’s Carbon Border Adjustment Mechanism (CBAM) reduces an importer’s charge only by the carbon price effectively paid abroad, net of any rebate (European Parliament and Council of the European Union 2025). A feebate or an intensity standard pays almost nothing net, so it earns nothing, although its marginal signal is the full rate. The TECP’s switching part, computed for one sector, measures that signal for price and non-price instruments alike: a feebate across steel routes scores its rate, a tradable standard its credit price (Brief 1.4). Equal signals are not equal costs: non-price policies generally impose lower private costs on firms than a carbon price at the same shadow price (Keen et al. 2022), so recognition on this basis rewards effort, not competitive burden.
Governments can see where their mix is weak. The TECP splits by sector, instrument and effect. In the example the weak point is road transport, which responds little to any carbon price at the margin; that argues for instruments aimed at vehicle choice rather than a higher fuel price.
What the TECP does not measure
It measures abatement, not cost. Two mixes with the same TECP cut the same tonnes but need not cost the same. Per tonne, standards and subsidies generally cost more than a price (Fischer and Newell 2008; Kalkuhl et al. 2013). Report the TECP beside each instrument’s shadow price and cost.
It is only as good as its inputs. Elasticities are known to ranges; taxes may move demand more than equal market price changes; and a government that reports its own standards’ costs has reason to overstate them. The example is stylized: the TECP has not yet been computed for a real country (working paper, limits).
What to do
Finance ministries and statistical offices: compute and publish the TECP beside explicit carbon prices. The inputs are an energy balance, delivered fuel prices, emission factors and two elasticities per sector; publish the weights so that others can reproduce the number, with a range and a one-year and long-run value.
The World Bank, the IMF and the OECD: add an effectiveness-weighted series to the total carbon price and the effective carbon rate. Use one shared set of elasticities across countries, so that common errors cancel, and compare the closed-form TECP with CPAT’s model-based equivalents for the same policies.
Climate-finance facilities: pay per tonne of change in the TECP, settled against observed emissions, so that standards, feebates and taxes earn on the same basis.
The European Commission: accept the sector’s switching-margin TECP as the measure of a foreign price signal, phased in alongside the price paid, as Brief 1.4 proposes (Stretton 2026c).
Regulators: publish the marginal compliance cost of every binding standard, so that it can enter the TECP and be compared with a carbon price.