The Macro-Fiscal-Energy Scenario Tool
Financing and efficiency, not the size of the program, decide what climate investment does to growth and debt
Finance ministries weighing climate investment get the budget cost, the carbon tax revenue, the growth effect and the debt test from different teams and models. The Macro-Fiscal-Energy Scenario Tool runs all four in one open workbook for 186 countries. In a stylized run, how a program is financed and how well public money is spent move debt and growth more than the program’s size. For Kenya, a net zero program needs 0.5 percent of GDP a year from the budget; carbon pricing on a clean grid covers about 5 percent of it. Ministries should use the tool to compare financing packages, not to forecast debt.
climate finance, public investment, debt sustainability, carbon pricing, macro-fiscal modeling
Climate Fiscal Policy Brief No. 6.5, October 2026. Stephen J. Stretton, writing in a personal capacity. The views expressed are the author’s own and do not represent those of any institution with which he is or has been affiliated. The full account, with the equations, the checks and the sources, is in the working paper. Country results are illustrative results from the tool, not official estimates.
Key messages
Read the full working paper → · Download this brief (pdf) · Slides (pdf)
A climate investment program changes the budget, the tax base, growth and debt at once, but ministries usually see these as four unconnected numbers. The Macro-Fiscal-Energy Scenario Tool puts them in one open workbook for 186 countries, with every assumption visible.
How a program is financed and how well the money is spent matter more than its size. Earmarked carbon revenue and concessional finance lower the debt path; the efficiency of public investment decides the growth gain.
Whether carbon pricing can pay depends on which political limit binds. When the loss to coal and oil generators binds, a tax and a feebate cut emissions equally, but only the tax raises revenue.
For Kenya, the mitigation bill is mostly land use and non-CO₂ gases, and carbon pricing pays for little of it. Kenya was at high risk of debt distress before the program; financing terms, not the program, decide what happens next.
Use the tool to compare packages, not to forecast debt. Check its starting point against the published debt sustainability analysis, and replace its defaults with country data, efficiency first.
Climate investment decisions need one answer on debt, and usually get four
A minister asked to commit to a climate investment program wants to know what it does to debt. That answer depends on four others. How much will the program cost the budget, once private investors and utilities have paid their share? How much could carbon pricing raise to pay for it? What will the spending do to growth? And what will all of that do to debt and the risk of debt distress?
Different teams usually answer these with different models, and the numbers do not add up. The energy team estimates investment needs; the tax team estimates carbon revenue; macroeconomists run a public investment scale-up through a growth model; the debt team runs the Bank-Fund debt framework. Each uses its own calibration and its own year, and the growth model rarely sees the revenue the pricing would raise.
The stakes are large. The IMF estimates that reaching net zero mainly through spending could raise public debt by 45 to 50 percent of GDP by 2050 in a representative large-emitting country, while a mix that includes carbon pricing holds the rise to 10 to 15 percent of GDP in an indicative advanced-economy case (International Monetary Fund 2023). A ministry needs to see that trade-off for its own country, in its own numbers.
One workbook runs the whole chain for 186 countries
The tool chains four models on one set of public country data. An investment model estimates what a net zero path needs to 2050 and who pays for it, from pure public spending through utilities and contracts to pure private investment. A pricing screen finds the most emission cuts a power-sector carbon tax, a feebate or a mix can deliver within limits on political cost. Simplified, open versions of three IMF and World Bank macro models turn the financed program into paths for GDP and debt (Kumhof et al. 2010; Marto et al. 2018). A simplified version of the Bank-Fund debt framework for low-income countries rates the risk of debt distress before and with the program (International Monetary Fund and World Bank 2018) (working paper, the tool).
Only the budget’s share of the investment, and only the part above current trends, reaches the macro models. Public buildings, access grids and land use fall on the budget; a viability-gap contract puts part of a private project there too. The tool also shows the larger need once weak project delivery is allowed for, using each country’s public investment efficiency; the IMF puts the average loss to inefficiency at around 30 percent (International Monetary Fund 2015) (working paper, investment needs).
A ministry economist can run a country in an afternoon. A country selector and a handful of levers drive the workbook: the program on or off, the shares of grants, concessional loans and commercial debt, the carbon pricing mode and the use of its revenue, and the political limits. Each result is a difference from a reference path that holds the country’s 2024 fiscal position fixed, so the tool is built to compare packages, not to forecast.
How the money is raised and spent matters more than how much
Earmarking carbon revenue cuts the debt peak without costing growth. In a stylized run, public investment of 1 percent of GDP a year for ten years raises GDP by 1.5 percent by year 10 and lifts debt from 50 to 57 percent of GDP. Earmarking carbon revenue of 0.5 percent of GDP a year holds the debt peak to 53 percent, with the same growth (Figure 1) (working paper, a stylized run).
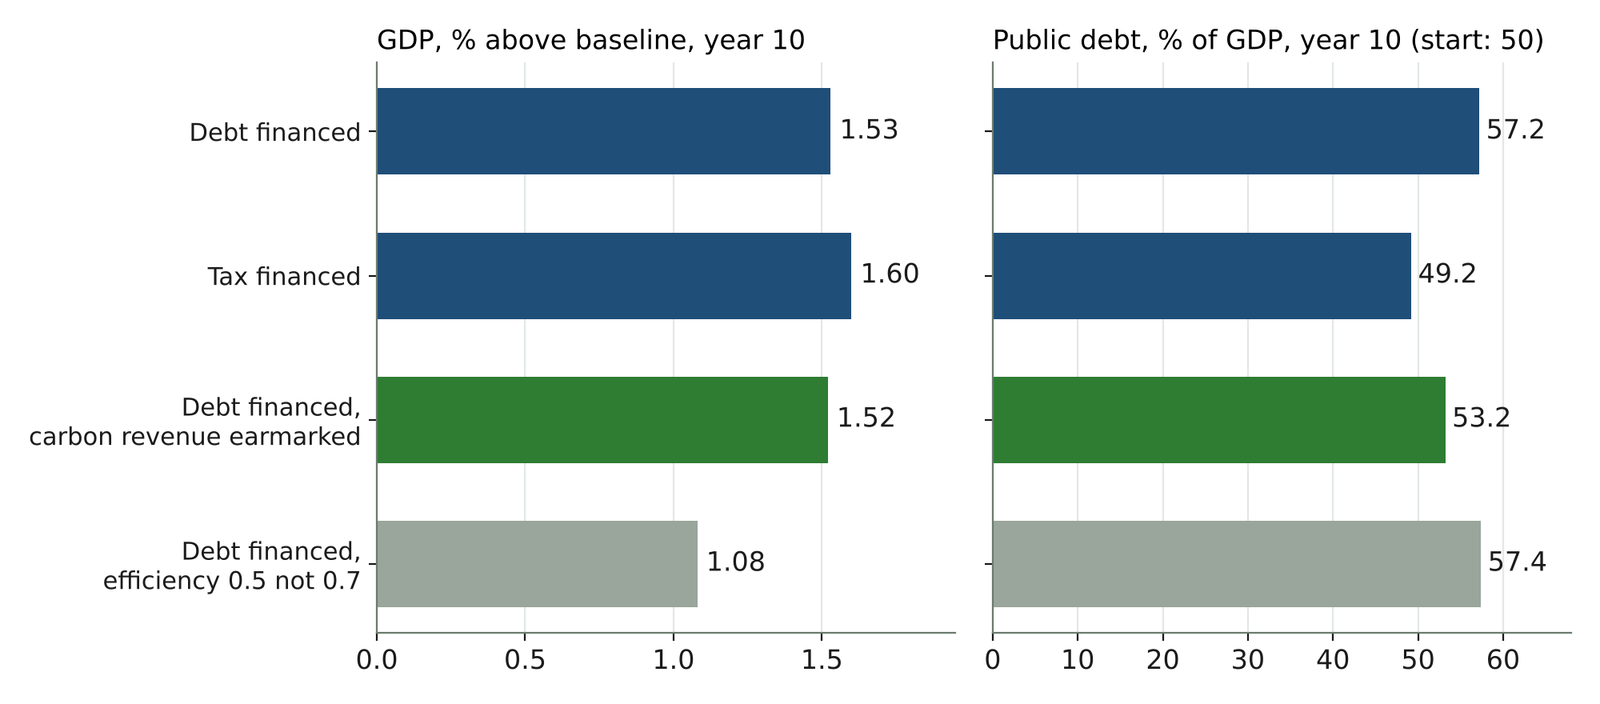
Low efficiency wastes the borrowing. If only half of each dollar becomes public capital rather than 70 cents, the GDP gain falls by 30 to 40 percent at every horizon and debt is unchanged: the same borrowing buys less capital. Evidence from developing economies agrees that public investment does more where it is spent well (Furceri and Li 2017).
For a low-income country, concessional finance is a debt question, not a growth question. In the low-income model, financing 30 percent of the program with grants and 30 percent with concessional loans keeps debt 2.4 points of GDP lower at its peak than all-commercial borrowing, and growth is almost the same. The growth case rests on efficiency and the return on public capital.
The binding political limit decides whether carbon pricing can pay
The tool screens carbon pricing against three political limits. The first is the visible rise in household electricity tariffs; the second is the loss to the poorest 40 percent of households; the third is the loss to coal and oil generators. The default limits are placeholders: setting them is a political judgment, and the tool shows what each choice costs in emission cuts and revenue (working paper, carbon pricing).
When the generators’ loss binds, a tax and a feebate cut emissions equally, but only the tax raises money. A feebate charges plants above a benchmark emissions rate and rebates those below it, so it changes the marginal price without raising the average tariff (Stretton 2026b). In a stylized power sector, the best tax (US$35 per tonne), the best feebate (US$38) and the best mix each cut fossil power emissions by about a quarter; only the tax raises revenue.
Rebating revenue to households does not help when generators are the binding constraint. Compensating the owners of high-emitting plants, or retiring them faster, would raise the feasible price. If generators recover less of the carbon cost than the default assumes, the feasible tax falls to US$22 per tonne and the best instrument becomes a pure feebate (working paper, a stylized run).
In Kenya, carbon pricing pays for little, and debt risk was high before the program
Kenya’s net zero program needs about 0.5 percent of GDP a year from the budget in 2030, and four-fifths of that is spending, not capital. Kenya’s power is already over 90 percent renewable (Ember 2026), so most of the incremental need is for land use and non-CO₂ gases. The direct budget need is 0.60 percent of GDP in 2030, and 0.81 percent once weak delivery is allowed for (Table 1) (Macro-Fiscal-Energy Scenario Tool 2026). The program goes beyond Kenya’s NDC, which aims to cut 2030 emissions 32 percent below a business-as-usual of 143 MtCO₂e (Republic of Kenya 2020).
| Tool result (illustrative) | Public figure | |
|---|---|---|
| Direct budget need, 2030 | 0.60% of GDP; 0.81% after the efficiency gap | |
| Incremental need entering the macro model, 2030 | 0.49% of GDP: capital 0.10, spending 0.39 | |
| Feasible power-sector carbon tax | US$88 per tonne | Fossil (oil) power: 0.74 MtCO₂ in 2024 |
| Pricing revenue | 0.05% of GDP in 2030; about 5% of the need to 2050 | |
| GDP effect, 2050 | +0.26% (low-income model); +4.6% (cross-check) | |
| Public debt added by 2050 | +7.2 points of GDP, against debt held at its 2024 level (67.3%) | IMF projects 71–74% of GDP in 2025–2030 |
| Debt-carrying capacity | Medium (indicator 2.73) | Medium (indicator 3.01) |
| Risk of debt distress, before and with the program | High and High | High |
A clean grid leaves little to tax. The feasible power-sector tax of US$88 per tonne applies to oil-fired plants that emitted under 1 million tonnes of CO₂ in 2024 (Ember 2026). It raises about 0.05 percent of GDP in 2030, a tenth of that year’s need and about 5 percent of the need to 2050 (working paper, Kenya).
The program adds about 7 points of GDP to debt by 2050 for a quarter of a percent of GDP. Most of the need builds no capital, so growth barely moves in the low-income model. A cross-check with the other model family gives a much larger GDP gain, 4.6 percent, because it credits energy savings and private investment; whether those happen in Kenya is the largest uncertainty. The 7 points are an addition to whatever path debt follows: the IMF already projects Kenya’s debt at 71 to 74 percent of GDP in 2025–2030 (International Monetary Fund 2026).
The published debt analysis confirms the tool’s rating and shows where it falls short. The joint IMF-World Bank analysis of December 2023 rates Kenya at high risk of debt distress with medium debt-carrying capacity, as the tool does (International Monetary Fund 2024). But its capacity indicator, 3.01, is higher than the tool’s 2.73, because the tool lacks trade data. And the shock that actually raised Kenya’s debt ratios, a falling real exchange rate in 2023–2024, is one the tool’s simplified models cannot show.
The tool compares packages; it does not replace a debt sustainability analysis
The simplified models are not their parents. They have one country, one good and a fixed real exchange rate, and they have been checked for internal consistency but not yet against the parents’ published simulations. Several inputs are income-group defaults. A result is a scenario to argue with, not a forecast, and it does not replace a calibrated IMF or World Bank model run, a debt sustainability analysis or a run of the Climate Policy Assessment Tool (CPAT Team 2023) (working paper, limits and use).
The tool earns its keep by showing which assumptions decide the answer. In both the stylized run and Kenya, those are the financing mix, the efficiency of public investment, the political limit that binds on pricing and the starting debt position. That tells a ministry where better data would pay most.
What to do
Finance ministries: compare financing packages, not program sizes. Run the program under grants, concessional loans and commercial debt, with and without earmarked pricing revenue, and read the change in the debt path and the risk rating. Treat the levels as a reference, not a projection.
Ministries and development-bank teams: start from the published debt analysis. Where an IMF-World Bank debt sustainability analysis exists, use its capacity rating and debt path as the reference, and use the tool to see how a program would move them. Add the depreciation stress the tool cannot run.
Fix efficiency before scaling up. In Kenya, closing the gap between spending and capital created would save the budget about 0.2 percent of GDP a year; in the stylized run, low efficiency cuts the growth gain by a third at the same debt.
Design carbon pricing around the limit that binds. Where generators’ losses bind, compensate or retire high-emitting plants, or use a feebate to cut emissions without raising tariffs; where revenue is the aim, a tax is needed. Where the grid is already clean, as in Kenya, plan to finance land-use and non-CO₂ needs with grants and concessional loans, as Kenya’s NDC does (Republic of Kenya 2020).
Replace defaults with country data in order of influence. Investment efficiency and the return on public capital first, then the financing mix, then trade data for the debt test, then the pricing assumptions, ideally from CPAT runs.