The Excise-Fiscal Diagnostic
Reading an Excise System Against Its Externalities
Excise schedules grow line by line for decades until nobody can read them whole, and few finance ministries can say whether their fuel, tobacco or alcohol taxes are high or low against the damage those goods do. The Excise-Fiscal Diagnostic is a repeatable report built for that question. It maps every line of a schedule onto 30 standard lines, scales each rate three ways (US dollars per standard unit, share of the consumer price, revenue as a share of GDP) and sets fuel rates against a corrective benchmark built from one fixed set of values for carbon, air pollution, accidents, congestion and road damage. An AI model drafts each stage under a written specification, and a country economist checks every line against the legal text. In a stylized economy, two-thirds of the corrective diesel tax is local damage rather than carbon. Applied to the 2026 excise law of Sierra Leone and Liberia, the diagnostic finds fuel taxed at USD 0.23 and 0.095 per liter, alcohol taxed inconsistently and health excises weakly collected; the review step corrected about a third of the AI-drafted entries. The binding constraint outside fuel is collection, not legislation.
excise taxation, corrective taxes, fuel taxes, health taxes, tax diagnostics, artificial intelligence
Working paper, version 0.4, October 2026. Stephen J. Stretton, writing in a personal capacity. The views expressed are the author’s own and do not represent those of any institution with which he is or has been affiliated. A short version for policy makers is Climate Fiscal Policy Brief No. 7.1. Companion paper to the Climate Fiscal AI Tools.1
1 Executive summary
Policy brief (short version) → · Download this paper (pdf) · Slides (pdf)
Most finance ministries cannot say, on one page, what their excise system taxes, how hard, and against what. An excise schedule in a lower-income country typically began with a few goods easy to tax at the port, then grew by amendment almost every year: a tobacco increase here, a mobile-money levy there, a cut for local beer, a rate left in an old currency. Excises raise about 1.3 percent of GDP on average across 37 African countries (2023), and they are the main price instruments a government has for carbon, air pollution, road deaths, tobacco and alcohol. Yet few ministries know whether a given fuel or tobacco rate is high or low against the damage the good does.
The Excise-Fiscal Diagnostic is a fixed-format report that reads a schedule whole and puts every line on a comparable scale. It sorts each line by its purpose, maps it onto a standard schedule of 30 lines with fixed units, and measures each rate three ways: US dollars per standard unit (for international comparison), share of the consumer price (for domestic debate and health targets), and revenue as a share of GDP (for the budget). It records how much each fixed-amount rate has lost to inflation since it was last changed.
For fuels it adds a benchmark built from one fixed set of damage values. The “externality spine” values carbon, local air pollution, congestion, accidents and road damage in dollars per liter, with the same parameters for every country, following the method the International Monetary Fund (IMF) uses to compute efficient fuel prices. For tobacco, alcohol and sugary drinks it uses the World Health Organization’s (WHO) published targets instead. The report shows the gap between each rate and its benchmark with a range, and leaves the decision to government.
An AI model drafts the report and a country economist checks every line against the gazetted law. The model works to a written specification in five stages, from reading the legal texts to the one-page summary. Every number is computed from a parameter sheet and carries a data-quality score; a comparator country can only come from another finished, reviewed run. The check matters: in the two country runs the line-by-line review corrected 16 and 14 of 49 entries.
In a stylized economy, diesel is taxed at less than half its corrective rate, and most of the gap is local, not carbon. With a carbon value of USD 50 per tonne, the corrective diesel tax is USD 0.43 per liter against a current USD 0.18; carbon accounts for 31 percent of it, air pollution 35 percent and road use 35 percent. Petrol, at USD 0.30, sits at its corrective rate only because inflation has eroded a rate that was 40 percent higher in real terms in 2020. Two choices move every result: valuing carbon at the USD 185 per tonne of recent damage estimates rather than USD 50 nearly quadruples the carbon part, and the method for transferring the value of a statistical life to a low-income country can move the health parts by a factor of five.
Run on the 2026 law of Sierra Leone and Liberia, the diagnostic finds low fuel taxes, inconsistent alcohol taxes and weak collection. Sierra Leone taxes petrol at USD 0.23 per liter; Liberia charges USD 0.095 in levies, less than the carbon cost alone at USD 50 a tonne. Liberia taxes spirits at under half the beer rate per liter of alcohol and booked no excise on imported tobacco in FY2024. Liberia’s excise law raises 0.37 percent of GDP, but its fuel and road levies, which work as excises, bring the total to 1.25 percent. Sierra Leone reports 1.25–1.28 percent for 2024–25, twice the OECD’s figure for 2023, a difference the diagnostic’s own reconciliation step has still to explain.
The binding constraint outside fuel is collection, not legislation. In both countries, health excises are on the books but collect little or cannot be traced in the accounts. The cheapest reforms the diagnostic identifies are administrative: index every specific excise to inflation under one rule, book each excise line separately, publish legible schedules, and run the diagnostic every budget cycle so that the change from last year shows on one page. The policy brief sets out the decisions in short.
2 Introduction
Excise schedules matter more for policy than their revenue suggests, yet few ministries can read them whole. Excises raised 1.32 percent of GDP on average across 37 African countries in 2023, and a median of 1.03 percent (OECD et al. 2025). That is a modest share of revenue. But excises are the main price instruments a government has for carbon emissions, local air pollution, road deaths, tobacco and alcohol, and they are adjusted almost every year. A typical schedule in a lower-income country is a document of several hundred lines in mixed units and sometimes mixed currencies, some specific and some ad valorem, a few indexed and most not. Each amendment made sense when it was passed. Taken together they rarely add up to a policy anyone chose.
This paper asks how a finance ministry can read its excise schedule whole, compare it with peers, and judge it against the external costs of the goods it taxes, using data it already holds and a process it can repeat every year. The answer is the Excise-Fiscal Diagnostic: a fixed-format report that standardizes every excise line, scales it on three comparable measures and sets the energy and health lines against benchmarks built from one fixed set of valuation parameters. Its bottom line is fiscal. For each priority line it shows what the line raises now, how hard it is taxed against peers and benchmarks, and where erosion, gaps and incoherence are costing revenue or leaving damage unpriced.
The diagnostic joins three bodies of work that do not otherwise meet. The IMF’s Getting Energy Prices Right method computes efficient fuel prices for every country from carbon, air pollution, congestion, accident and road damage costs (Parry et al. 2014), and the IMF’s fossil fuel subsidy data apply it to 170 countries (Black et al. 2023). That is a comparison of retail fuel prices with efficient prices, not a reading of any country’s tax law, and it leaves out tobacco, alcohol and sugary drinks. WHO publishes targets and manuals for tobacco, alcohol and sugar taxes (World Health Organization 2021, 2023a, 2016), but not for fuels. The excise-design literature explains why excises exist and how to set them (Cnossen 2005; Chaloupka et al. 2019), but gives a ministry no standard format for its own schedule. The diagnostic contributes a line-level reading of the legal schedule against one standard schedule for all excise categories, a common valuation spine for the fuel lines, health targets for the rest, data-quality scores that travel with every number, and a checked production process that an AI model drafts and a country economist reviews.
Three findings stand out. In a stylized economy, two-thirds of the corrective tax on diesel is local damage rather than carbon, so a reform case for diesel rests mainly on health and road safety. In two country runs, the review stage corrected about a third of the AI-drafted entries, so the check is the method, not an add-on. And in both countries the gap outside fuel is collection rather than legislation. Section 3 to Section 6 set out the method; Section 7 and Section 8 apply it; Section 9 states the strongest objections; Section 10 covers validation, limits and use.
3 What the diagnostic is for
The diagnostic is a structured snapshot of an excise system, not a model. It is diagnostic in the medical sense: a first examination that finds what is there, what is missing and what is moving. It does not forecast revenue, estimate behavioral responses beyond a first-order correction, or recommend rates. It puts the evidence for those decisions on one page and in one format, so that a minister, a tax policy unit and a development partner argue about the same numbers.
It answers seven questions, four of them from the schedule alone. Coverage asks what the schedule taxes and which priority categories (fuels, tobacco, alcohol, sugar-sweetened beverages, plastics, gambling) are missing. Structure asks whether each line is specific, ad valorem or a hybrid, and how it is differentiated by origin, content, user or alcohol band. Intensity asks how heavily each line is taxed on the three measures. Erosion asks which specific rates are losing real value. These four make up the minimum version and need only the schedule, its amendment history and a handful of parameters: an exchange rate, GDP, reference prices, volumes and a price index. Three further questions need outside data. Benchmarking compares intensities with peers and international references. Coherence asks where differentiation devices stack into rate inversions or arbitrage. Price tracking asks how the tax-inclusive price of each taxed good has moved against inflation and incomes.
The externality spine adds an eighth question: is each line set against the damage it should price? The spine is a common scale that puts carbon, air pollution, accidents, congestion and road damage side by side, in US dollars per liter of fuel, using one fixed set of valuation parameters. For the health lines, published targets play the same role. Together they turn “is this line high or low?” into “is this line high or low against what it is for?”, which is the question a finance minister needs answered before raising a rate.
The diagnostic deliberately does not adjudicate. It reports a gap between a statutory rate and a benchmark, with a range. Whether to close it, how fast and with what compensation is a political decision that depends on revenue needs, incidence and the state of the economy. Keeping measurement apart from recommendation lets a ministry accept the first while it argues about the second.
4 Reading the schedule
4.1 Typology and the standard schedule
Every line is assigned to one of seven categories by its policy rationale, not by its tariff code. The categories are energy and environment (including transport and plastics); health and gambling (tobacco, alcohol, sugar-sweetened beverages, gambling); luxury; telecommunications and digital services; financial transactions; industrial inputs and legacy residuals (cement, edible oils, soap); and resources. A line that fits two categories goes to its dominant rationale: an annual vehicle levy is energy and transport, not luxury. Sorting by rationale forces an answer to the question most schedules never answer for themselves: what is this excise for? The classic objectives are revenue, external cost, discouraging consumption and charging road users (Cnossen 2005). A cement excise with none of these stated is a revenue line that has outlived its reason, and the typology puts it on the page as such.
Each national line is then mapped onto a fixed standard schedule of 30 lines. The standard schedule (version 1.0) has six fuel lines (petrol, road diesel, kerosene, aviation fuel, heavy fuel oil, lubricants), two vehicle lines (annual circulation; first registration or import), three tobacco lines (cigarettes per pack of 20, other tobacco, e-cigarettes), five alcohol lines (mainstream beer, local-content beer, traditional beer, wine and spirits, all per liter of pure alcohol), four beverage lines (soft drinks, juice, energy drinks, bottled water), and one line each for plastics, gambling, voice, data, mobile money, cement, edible oils, sugar, other inputs and luxury goods. Each standard line has a fixed physical unit. A national line with no counterpart is recorded; a standard line with no national counterpart is recorded as not covered. The rows never change within a version, so the tenth country mapped can be compared with the first without rework.
Each line is recorded on five fields. These are its category; the item as printed in the schedule; the current rate in local currency at a stated legal cut-off date; its structure and differentiation (specific, ad valorem or hybrid, and any differentiation by origin, content, user or alcohol band); and its history since 2020, with every amendment and any pending bill. A pending bill is flagged but never applied. Customs duties are excluded even where they behave like excises, and noted. Levies outside the excise law that work as excises in substance, such as road fund and fuel-price levies, are recorded as excise-like levies and counted with the excise when revenue is compared across countries, because international revenue statistics count them that way (Section 8).
4.2 Three comparable measures
A rate on its own is a local-currency number against a locally defined product; the diagnostic scales it three ways. Read together, the measures triangulate a line’s policy intensity. A rate that is low per unit but high as a share of price says the product is cheap; one that is high per unit but low as a share of price says it is expensive; one that is high on both but raises little revenue says the base is small or the tax is not collected.
The first measure is excise per standard physical unit, in US dollars. For line \(j\) with statutory rate \(r_j\) in local currency per legal unit,
\[ m^{U}_j = \frac{r_j \, c_j}{X \, a_j}, \tag{1}\]
where \(X\) is the exchange rate in local currency per US dollar at the cut-off date, \(c_j\) converts the legal unit to the standard unit (0.02 to turn a rate per 1,000 cigarettes into a rate per pack of 20), and \(a_j\) is the representative alcohol content for alcohol lines (5 percent for beer, 4 percent for traditional beer, 12 percent for wine, 40 percent for spirits) and 1 otherwise. For ad valorem lines, \(r_j c_j\) is replaced by the rate times a representative taxable value. This measure is the one for international comparison, because it cuts through differences in schedule architecture. Its weakness is that it hides whether a rate is specific or ad valorem, which decides how it behaves under inflation.
The second measure is excise as a share of the consumer price. With \(\tau_j\) the excise per retail unit and \(p_j\) the typical tax-inclusive retail price,
\[ m^{P}_j = \frac{\tau_j}{p_j}, \qquad \tau_j = \max\left(\tau^{s}_j,\; \theta_j \, v_j\right) \tag{2}\]
for a “higher-of” hybrid with specific component \(\tau^{s}_j\), ad valorem rate \(\theta_j\) and taxable value \(v_j\). The binding component is reported. Where the legal base (ex-factory or import value) is not observed, the ad valorem rate is applied to the retail price and the result is labeled an upper bound. This measure is the one for domestic debate and for health targets, which are set as shares of retail price. Its weakness is that it moves with the chosen reference price, so the diagnostic reports a range where prices vary by brand or region.
The third measure is implied revenue as a share of GDP. With \(Q_j\) the annual taxed volume and \(Y\) nominal GDP in US dollars,
\[ m^{R}_j = \frac{\tau_j \, Q_j}{X \, Y}. \tag{3}\]
This measure puts each line in macro-fiscal terms. It is also the most error-prone, because line-level volumes are rarely published. Where the revenue authority publishes collections by line, collections replace the implied figure; where it does not, the implied figure is reported next to whatever aggregate collections exist. Volumes inferred from prevalence surveys (adult smokers times cigarettes a day) include untaxed and illicit supply and are labeled upper bounds. The uncertainty is real: in Sierra Leone the implied tobacco excise runs from 0.09 to 0.17 percent of GDP depending only on whether smokers are assumed to smoke 5 or 10 cigarettes a day (Excise-Fiscal Diagnostic 2026).
4.3 Erosion
Erosion is measured as the real value of each specific rate since its last change. With \(P_t\) a consumer price index, a specific rate unchanged since year \(s\) keeps \(P_s/P_t\) of its real value in year \(t\). Laying out the year-by-year trajectory since 2020 makes the erosion-and-catch-up cycle visible: long periods of decline ended by a large nominal increase that is politically expensive because it looks large. A schedule whose specific rates have not moved for five years at 7 percent inflation has handed back 29 percent of their real value without any decision to do so. Rates printed in US dollars, as in Liberia, do not erode with the local currency but still lose value with US inflation. WHO recommends regular, ideally automatic, inflation adjustment of specific tobacco and alcohol excises for this reason (World Health Organization 2021, 2023a).
4.4 The four-level report
The report is a pyramid, read from the top and built from the bottom. Level 1 is the page a minister reads: key metrics on the three measures, headline findings, inconsistencies, peer comparison and issues for policy dialogue. Level 2 is the standard schedule, with every national line mapped to it and each standard line scored in US dollars per unit and as a share of price. Level 3 is the country’s own schedule on the five fields, with its rate trajectory. Level 4 is the raw data: the parameter sheet (exchange rate, GDP, prices, volumes, conversion factors), each with a source and a status, the line-level computations and the legislative history. Each level can be checked against the one below it, and nothing appears at Level 1 that Level 4 does not compute.
Every report ships with a workbook in a fixed layout. Its sheets are a summary, country metrics, the standard schedule in human-readable form, the same schedule in long format with one row per rate component (a higher-of hybrid has two rows), parameters, a data-quality scale and sources. US dollar values and data-quality scores are formulas, not typed numbers. Because every country’s workbook has the same columns, a regional comparison is a matter of stacking files.
5 The externality spine and the benchmarks
5.1 Why one spine
A corrective tax is only defensible if the damages behind it are valued consistently. An analyst who values a statistical life at one figure for air pollution and another for road accidents, or applies a 2020 carbon value to diesel and a 2030 value to coal, produces benchmarks that cannot be added and will not survive a skeptical ministry. The externality spine fixes the valuation parameters once for every country report and applies them across all components. Country data enter through quantities (fuel volumes, exposure, road deaths, vehicle stocks); the values applied to those quantities come from one table. This is what makes the components of a corrective fuel tax comparable with each other and across countries.
5.2 The corrective fuel tax
The benchmark for road fuels is the corrective tax of the optimal-tax literature. Sandmo showed that, under standard conditions, an externality enters the optimal tax only on the good that causes it, as a term added to that good’s revenue-raising (Ramsey) tax (Sandmo 1975). For motor fuel the corrective term depends on how the fuel causes damage. Carbon and, approximately, local air pollution are proportional to fuel burned. Congestion, accidents and road damage are proportional to distance driven, so a tax per liter corrects them only in proportion to how much of the fall in fuel use comes from driving less rather than from more efficient vehicles (Parry and Small 2005; Parry et al. 2007). The IMF method puts this in operational form (Parry et al. 2014):
\[ t^{*}_f = e^{C}_f + e^{P}_f + \beta \left( e^{G}_f + e^{A}_f + e^{R}_f \right), \tag{4}\]
where all terms are in US dollars per liter. \(e^{C}_f = \phi_f \, s^{C}\) is the carbon cost: the fuel’s carbon dioxide content \(\phi_f\) times the carbon value \(s^{C}\). On IPCC default emission factors and calorific values (IPCC 2006) and typical densities (0.745 kg per liter of petrol and 0.84 of diesel, the author’s assumption), \(\phi_f\) is 2.29 kg per liter of petrol and 2.68 kg per liter of diesel. \(e^{P}_f\) is the local air pollution cost, mostly premature deaths from fine particulates valued at the value of a statistical life. \(e^{G}_f\), \(e^{A}_f\) and \(e^{R}_f\) are the congestion, accident and road damage costs per liter. \(\beta\) is the share of the fuel-demand response that comes from reduced driving. If half the response to a fuel tax is fewer kilometers and half is better fuel economy, only half of the distance-related damage is corrected through the fuel tax; the rest is better addressed by distance charges, congestion pricing or vehicle standards. The simple sum of the five components (the “naive Pigouvian” rate) is reported beside \(t^{*}_f\) as an upper bound. Parry and Small treat local pollution from petrol cars as distance-related, because emission standards are set per kilometer (Parry and Small 2005); the diagnostic keeps the simpler fuel-based form and says so.
The corrective rate is a floor for a defensible fuel tax, not the optimal rate. equation 4 omits the Ramsey term. Where fuel is one of the few bases a government can tax well, the efficient fuel tax exceeds the corrective rate (Parry and Small 2005; Cnossen 2005). The diagnostic reports the corrective rate because it is the part of the argument that does not depend on a government’s revenue needs, and says so on the page (Section 9).
The gap is the corrective rate less the current effective rate. The current effective rate is the excise plus any fuel levies that work as excises in substance (road fund, regulator and price-stabilization levies), less any explicit subsidy per liter. Value added tax is excluded because it applies to all consumption. The gap \(g_f = t^{*}_f - \tau_f\) is reported with a range from the low and high cases of the spine. Because the current tax is not earmarked to any one damage, the gap itself cannot be split by component; what the report decomposes is the corrective rate. That decomposition matters more than the total: a diesel benchmark made up mostly of air pollution and accident costs makes a health and road-safety case for reform, not a climate case, and the case a government makes affects whether a reform survives.
5.3 Valuation defaults
The spine’s defaults are set once, published with their sources and varied in a stated range. Table 1 lists them. They are defaults for the product, not recommendations: a country team may depart from one with a written justification, and the report then shows the result at the default as well.
| Parameter | Default | Sensitivity | Basis |
|---|---|---|---|
| Carbon value, \(s^{C}\) | USD 50/tCO₂ | 25–100; social-cost case 185 | Middle tier of a proposed international price floor for 2030 (Parry et al. 2021); damage estimate for the social-cost case (Rennert et al. 2022) |
| Value of a statistical life (VSL) | 100 × income per head (OECD base), income elasticity 1.0 | US base, elasticity 1.5, floor 20 × income | OECD (2012); both options from Robinson et al. (2019) |
| Mileage share of fuel response, \(\beta\) | 0.5 | 0.35–0.65 | Author’s default; concept from Parry and Small (2005) |
| Fuel price elasticity | −0.3 short run, −0.6 long run | −0.1 to −0.8 | Meta-analytic averages (Labandeira et al. 2016, 2017); bias-corrected values (Havranek et al. 2012) |
| Air pollution mortality | Country estimates where they exist; global burden estimates otherwise | From exposure–response uncertainty | Method as in Parry et al. (2014) |
| Accident costs | Road deaths corrected for under-reporting × VSL × morbidity factor | From death counts | World Health Organization (2023b); Schroten et al. (2019) |
The carbon default is a policy-anchored value well below damage estimates. USD 50 per tonne is the middle tier of an IMF staff proposal for an international carbon price floor in 2030, which set floors of USD 75, 50 and 25 for advanced, high-income emerging and low-income emerging economies among six large emitters (Parry et al. 2021). It is a negotiable floor, not a measure of damage. The leading recent damage estimate is USD 185 per tonne (2020 dollars; 5–95 percent range 44–413) at a 2 percent discount rate (Rennert et al. 2022). At USD 185 the carbon component is USD 0.42 per liter of petrol and 0.50 per liter of diesel, against 0.11 and 0.13 at USD 50. The diagnostic keeps USD 50 as its default because a ministry is more likely to accept a benchmark built on a price that governments have discussed than on a damage estimate, and it reports the social-cost case beside it so that the choice is visible.
The value of a statistical life is transferred from a base by income, and the choice of base moves the health components by a factor of up to five. For country \(c\) with income per head \(y_c\),
\[ \text{VSL}_c = \text{VSL}_{b} \left( \frac{y_c}{y_b} \right)^{\eta}. \tag{5}\]
The diagnostic’s default takes an OECD-based ratio of 100 times income per head with \(\eta = 1\), so the value is proportional to income (OECD 2012). The global benefit-cost guidance of Robinson, Hammitt and O’Keeffe recommends instead a United States base (USD 9.4 million, 160 times income per head) with \(\eta = 1.5\) and a floor of 20 times income, and treats the OECD-based approach as a sensitivity case (Robinson et al. 2019). The two differ most where incomes are lowest. At an income of USD 800 per head the default gives USD 80,000 and the recommended approach USD 16,000, where the floor binds: a factor of five. Because air pollution and accident costs are the largest components of the diesel benchmark in lower-income countries, the report shows both.
5.4 Health benchmarks
For tobacco, alcohol and sugar-sweetened beverages, the diagnostic uses published targets instead of computing externalities. The external and internal costs of these goods (health care paid by others, harm to others, and harm to consumers who misjudge addiction or their own self-control) are harder to value per unit than fuel damages and are contested (Allcott et al. 2019; Chaloupka et al. 2019). The health literature has instead settled on targets that ministries recognize. WHO’s technical manual recommends that excise make up at least 70 percent of the retail price of tobacco products, with specific or mixed structures and regular adjustment for inflation; WHO’s monitoring indicator rates a total tax share of at least 75 percent as best practice (World Health Organization 2021). The diagnostic uses the excise target because it isolates the excise. For sugar-sweetened beverages, WHO finds that taxes that raise retail prices by 20 percent or more cut consumption roughly in proportion (World Health Organization 2016).
For alcohol the diagnostic tests consistency rather than level. Expressing every alcohol line per liter of pure alcohol shows whether a country taxes the same harmful content at very different rates across beer, wine and spirits, just as expressing fuel taxes per tonne of carbon shows inconsistent carbon pricing across fuels (Stretton 2026c). WHO considers specific taxes based on alcohol content the best design for reducing harm (World Health Organization 2023a). Consistency is a test, not a rule: where heavy drinkers favor particular products, differentiated rates can do better than a uniform rate per liter of alcohol (Griffith et al. 2019). An inversion in which the strongest drink pays least per liter of alcohol has no such defense, and the report flags it.
The health and energy lines are read on one page because they share a design question. Health and climate practitioners both favor specific rather than ad valorem rates for corrective excises, since the damage depends on quantity, not price, and both favor automatic indexation so that real rates do not erode between finance acts (World Health Organization 2021, 2023a). A diagnostic that finds unindexed specific rates on fuel, tobacco and alcohol can recommend one indexation rule that covers all three, which is cheaper politically than three separate fights.
5.5 Depth by data
The same spine runs at two depths. With good data the report uses country-specific elasticities, air pollution attributed by source and separate urban and rural profiles. With weak data it uses pooled elasticities, global burden-of-disease estimates and congestion only for the main city, and reports direction and magnitude with a range. A finding that diesel is undertaxed in every plausible case is more useful to a ministry than a falsely precise point estimate.
6 The AI-assisted process
6.1 Stages
The diagnostic is produced by an AI model working to a written specification, with a country economist directing and checking each stage. The pilots used Claude (Anthropic). The process follows the report from the bottom up in five stages, with an AI review pass at the end of each and a human review before anything moves up a level (Table 2). The specification is written to be given to the model directly as context, so the method travels with the instructions rather than with the person who ran it last.
| Stage | Task | Output |
|---|---|---|
| A1 | Read the schedule: find the 2020 starting point and every amendment since, through the latest finance act; flag pending bills | Legislative history and raw rate data (Level 4) |
| A2 | Determine the current legal position; record every line on the five fields | Country schedule (Level 3) |
| A3 | Map national lines onto the standard schedule; convert units; compute the three measures from the parameter sheet; populate the workbook | Standard schedule (Level 2) and workbook |
| A4 | Aggregate into key metrics; compare with a reviewed comparator and benchmarks; identify inconsistencies | Top level (Level 1) |
| A5 | Peer review: give every line a source reference, check it against the source text, correct the report | Reference register |
A schedule can be run whole or in five parts. A whole run covers all 30 standard lines and suits a first diagnostic or a small schedule. A sectoral run splits the work into fuel, vehicles, health (with sugar), other lines (plastics, gambling, telecommunications, financial transactions, cement and other inputs, luxury), and an overarching part that runs last. Every standard line belongs to exactly one part. The first part to run writes a common header (country, cut-off date, currency notation, exchange rate, GDP, price index, list of legal instruments) that every later part reuses unchanged. The overarching part holds what belongs to no single sector (aggregate revenue, the legal framework, the indexation rule and a reconciliation of collections across the revenue authority and the finance ministry) and stacks the four part workbooks into one.
6.2 Quality rules
The quality rules exist because the pilots broke each of them once. Every number is computed from the parameter sheet; none is typed into the narrative. An early pilot draft carried revenue figures that did not follow from its own inputs, and the Level 4 computations caught them. Every legal line carries at least one reference to a source document, section and page: no reference, no line. An early draft misread a currency notation after a redenomination, and a later draft missed a whole finance act; the line-by-line review caught both. Rates are quoted as printed, with their currency notation. If a table cannot be read, the report says “not legible” and shows the last legible rate. The model may not rely on memory for any rate or data point.
Each figure carries a data-quality score, and a derived figure takes the lowest score of its inputs. The scale runs from 5 (matches the gazetted text or official data, quote on file) through 4 (corrected in review and now matching), 3 (confirmed only in an official secondary source), 2 (not yet verified, or estimated from published inputs) to 1 (assumption, last legible rate or data gap). The rule that a derived figure inherits its weakest input means an implied revenue figure built on a guessed volume cannot present itself as better than a guess. The workbook computes the score by formula.
A comparator comes only from another finished diagnostic. The model may not fill comparator columns from memory or web search, or analyze a second country inside the same run. To compare country A with country B, B is run and reviewed first, and its report and workbook are supplied to A’s run. Both must use the same standard-schedule version and conversion rules. Without a comparator, Level 1 benchmarks only against international references.
When the model cannot fetch a source, it stops and asks. Government websites block automated access and scanned tables cannot be read as text. Rather than fill the gap, the model lists the documents it needs with a short download script; the user runs it and uploads the files, and the model checks each one before resuming.
AI drafting speeds up the work; it does not replace the check against the gazetted text. The time saved is in reading, converting and laying out. The time that remains is in checking, and the process is built so that checking cannot be skipped. Section 8 reports how much the check found.
7 A stylized example
7.1 Country A
Country A is fictitious; every input below is a labeled stylized number. It is a lower-middle-income economy with GDP of USD 40 billion in 2025, an exchange rate of 100 local currency units (LCU) per US dollar, and consumer prices 40 percent higher than in 2020. Its schedule has five priority lines: petrol at LCU 30 per liter, road diesel at LCU 18 per liter, cigarettes at LCU 1,500 per 1,000 sticks, beer at LCU 40 per liter, and spirits at 30 percent of an ex-factory value of LCU 600 per liter. All the specific rates were last changed in 2020. It has no excise on sugar-sweetened beverages. Retail prices, volumes and externality costs are set out in the code that produces every number in this section (2.Source/stylized_example.py).
7.2 What the three measures show
On the three measures, Country A’s schedule looks unremarkable until the lines are read against each other. Table 3 gives the Level 2 view. Petrol and diesel raise 1.65 percent of GDP between them and dominate revenue. The cigarette excise is USD 0.30 a pack and 20 percent of the retail price. Beer is taxed at USD 8.00 per liter of pure alcohol and spirits at USD 4.50.
2.Source/stylized_example.py.
| Line | Rate as printed | USD per standard unit | Share of retail price | Implied revenue, % of GDP |
|---|---|---|---|---|
| Petrol | LCU 30 per liter | 0.30 per liter | 27% | 0.75 |
| Road diesel | LCU 18 per liter | 0.18 per liter | 17% | 0.90 |
| Cigarettes | LCU 1,500 per 1,000 sticks | 0.30 per pack of 20 | 20% | 0.11 |
| Beer (5% ABV) | LCU 40 per liter | 8.00 per liter of pure alcohol | 20% | 0.30 |
| Spirits (40% ABV) | 30% of ex-factory value | 4.50 per liter of pure alcohol | 15% | 0.07 |
| Sugar-sweetened beverages | Not covered | — | — | — |
Four findings come out of the table before any externality is valued. First, coverage: there is no excise on sugar-sweetened beverages, a gap the report records as a choice for government rather than an oversight. Second, coherence: spirits pay 44 percent less per liter of pure alcohol than beer, because the spirits rate is ad valorem on a low declared factory value while beer is specific. The same harmful content is taxed at two rates, and the cheaper rate falls on the stronger product. Third, intensity against a health target: the cigarette excise is 20 percent of the retail price, against WHO’s target of at least 70 percent (World Health Organization 2021). Fourth, erosion: with every specific rate unchanged since 2020 and prices up 40 percent, each has lost 29 percent of its real value. The petrol excise set at LCU 30 in 2020 would be LCU 42, or USD 0.42 per liter, in today’s prices.
7.3 What the externality spine adds
Against the spine, petrol is taxed at its corrective rate and diesel at less than half of it. Table 4 applies equation 4 with the defaults of Table 1 and stylized per-liter costs for air pollution, congestion, accidents and road damage. The petrol corrective rate is USD 0.30 per liter, the same as the current rate. The diesel corrective rate is USD 0.43 against a current USD 0.18, a gap of USD 0.25 per liter. Figure 1 shows the same numbers.
2.Source/stylized_example.py.
| USD per liter | Petrol | Diesel |
|---|---|---|
| Carbon, \(e^{C}\) (USD 50/tCO₂) | 0.11 | 0.13 |
| Local air pollution, \(e^{P}\) | 0.04 | 0.15 |
| Congestion, \(e^{G}\) | 0.10 | 0.05 |
| Accidents, \(e^{A}\) | 0.20 | 0.20 |
| Road damage, \(e^{R}\) | 0.00 | 0.05 |
| Naive sum | 0.45 | 0.58 |
| Corrective rate, \(t^{*}\) (\(\beta\) = 0.5) | 0.30 | 0.43 |
| Range (low to high case) | 0.13–0.67 | 0.20–0.91 |
| Current excise | 0.30 | 0.18 |
| Gap at central values | 0.00 | +0.25 |
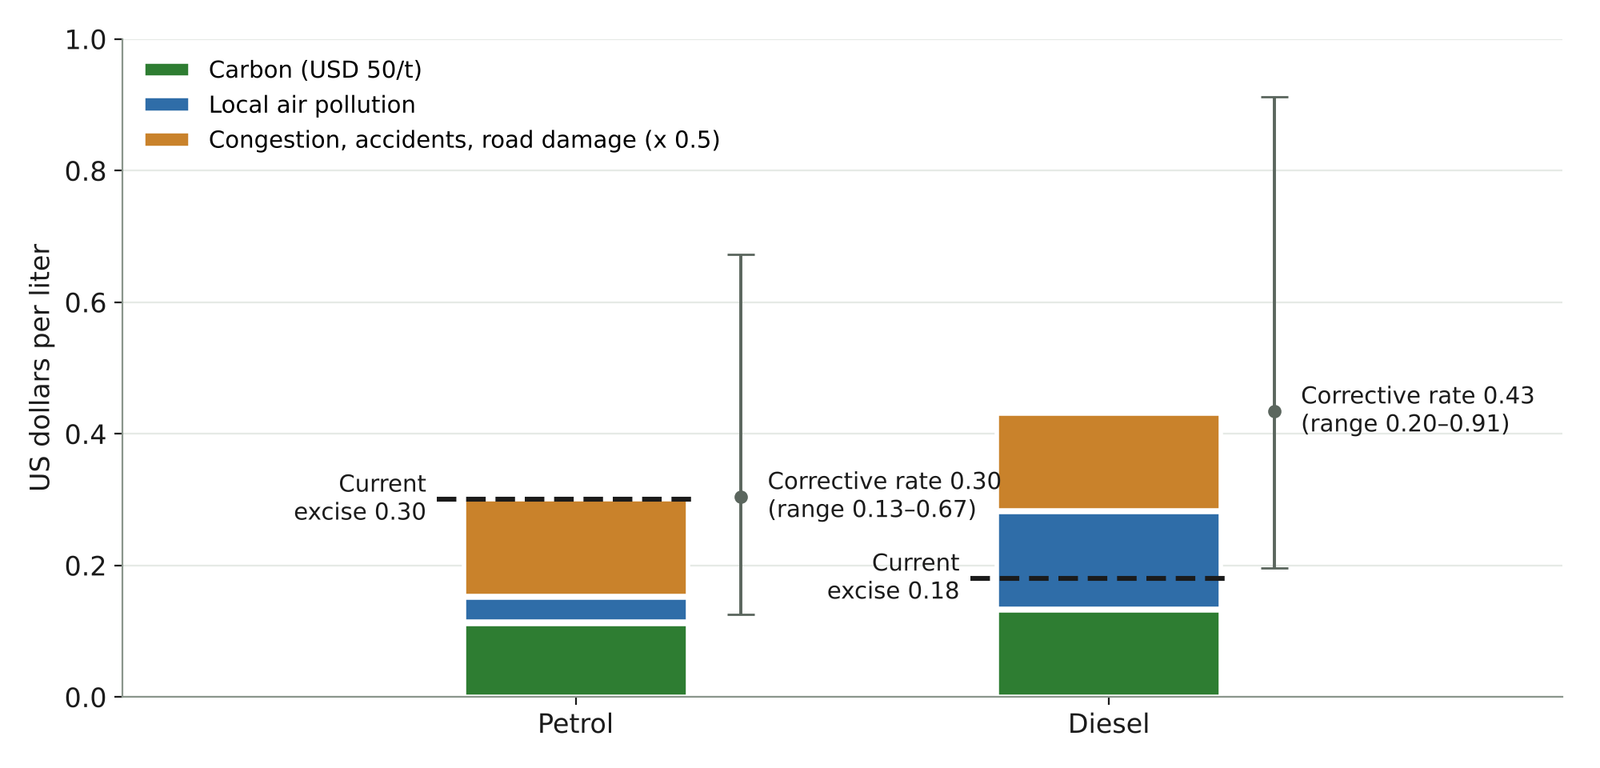
2.Source/stylized_example.py.
Two-thirds of the diesel benchmark is local damage, not carbon. At the central values, carbon is 31 percent of the diesel corrective rate, local air pollution 35 percent, and congestion, accidents and road damage after the mileage adjustment 35 percent. Air pollution and carbon are close in size on these stylized inputs, so the finding that holds is not that one dominates but that local damage is twice the climate damage. A reform case for diesel built on carbon would rest on the smaller part of the argument. The report says this in its Level 1 findings, where it shapes how a reform is framed: as a health and road-safety measure first.
Closing the diesel gap would raise between 1.1 and 1.2 percent of GDP in the stylized economy. The static gain is USD 510 million, 1.27 percent of GDP. With a short-run price elasticity of −0.3 and full pass-through to a pump price of USD 1.05, diesel use falls about 7 percent and the gain is 1.11 percent of GDP; with −0.1, closer to the publication-bias-corrected estimates for gasoline (Havranek et al. 2012), use falls 2 percent and the gain is 1.22 percent (Brief 5.4 discusses why published elasticities overstate the response). The range of the gap is wide, from USD 0.02 per liter in the low case to USD 0.73 in the high case, and showing it is what stops one challenged parameter from discrediting the whole report.
The spine’s two most contested parameters move the result more than any other. Moving \(\beta\) alone from 0.35 to 0.65 moves the diesel corrective rate from USD 0.39 to 0.48 per liter. Valuing carbon at USD 185 instead of 50 moves it to USD 0.80, and petrol’s to USD 0.61, so that both fuels are undertaxed by a wide margin. The value of a statistical life moves the air pollution and accident components, together more than half (58 percent) of the diesel benchmark at central values, in proportion, and the two transfer methods of Section 5.3 differ by up to a factor of five.
The petrol result is a warning against reading the spine alone. Petrol was taxed about 40 percent above its corrective rate in real terms when its rate was set in 2020 (USD 0.42 in today’s prices against 0.30). Inflation has since brought it down to the benchmark without any decision, and unindexed it will fall further below it every year. The finding for petrol is about indexation, as it is for tobacco and beer, and one indexation rule covering every specific excise is the cheapest reform the report identifies.
8 Two applications: Sierra Leone and Liberia
8.1 The runs
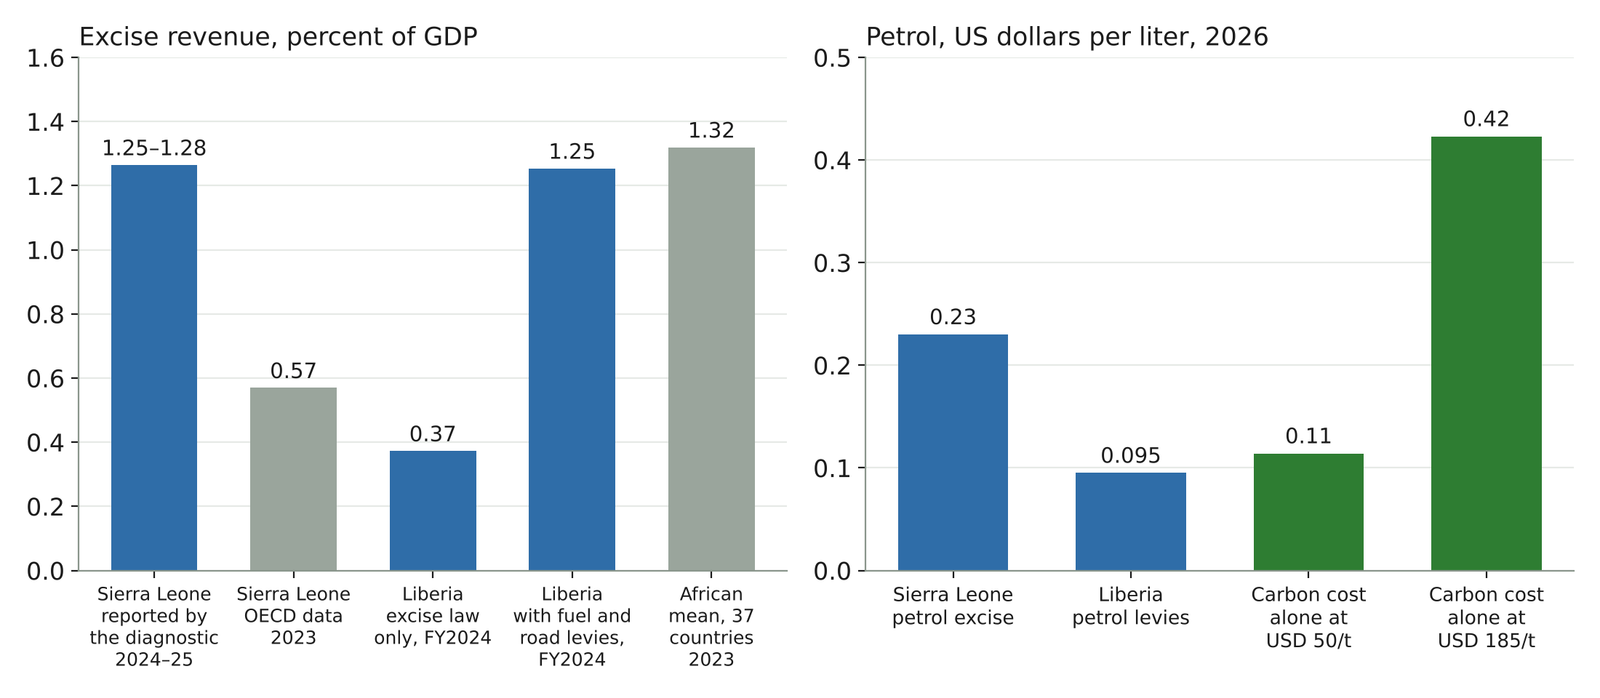
The diagnostic has been run on the 2026 excise law of Sierra Leone and Liberia, and both runs were checked line by line against the legal texts. The Sierra Leone run reads the Excise Act 1982 as amended through the Finance Act 2026, at a legal cut-off of 27 April 2026. The Liberia run reads Part IV, Chapter 11 of the Revenue Code as amended through the Tax Amendment Act of December 2025, at a cut-off of 29 September 2026. Each run’s peer review checked 49 entries: in Sierra Leone it verified 18, confirmed 11 in part, corrected 16 and could not verify 4; in Liberia the counts were 22, 11, 14 and 2 (Excise-Fiscal Diagnostic 2026). Table 5 gives the Level 1 figures from the two runs’ shared workbook. They are illustrative results from the diagnostic, not official estimates. Sierra Leone’s US dollar values use a working exchange rate of NLe 22 per dollar and may be about 4 percent high; Liberia prints its excise rates in US dollars.
2.Source/country_metrics.py; African mean and OECD data from OECD et al. (2025), computed by 2.Source/africa_excise_benchmark.py (excises, category 5121, unweighted across 37 countries); carbon component from equation 4; WHO target from World Health Organization (2021); UK rates from HM Revenue and Customs (2026).
| Measure | Sierra Leone | Liberia | Reference |
|---|---|---|---|
| Excise in the excise law, % of GDP | 1.25–1.28 (2024–25) | 0.37 (FY2024) | African mean 1.32, median 1.03 (2023) |
| Excise plus excise-like levies, % of GDP | not reported | 1.25 (FY2024) | As above (international data count such levies as excise) |
| Excise in OECD data, % of GDP (2023) | 0.57 | 0.99 | — |
| of which fuel, % of GDP (diagnostic) | 1.12–1.15 | none in the excise law; levies 0.67 (Road Fund) | — |
| Petrol, USD per liter (share of pump price) | 0.23 (16%) | 0.095 in levies (7.3%) | Carbon component 0.11 at USD 50/t; 0.42 at USD 185/t |
| Cigarettes, USD per pack of 20 (share of retail price) | 0.14 (about 14%) | 0.50 (27%, 2022 price) | WHO: excise at least 70% |
| Beer, USD per liter of pure alcohol | 2.3–9.1 local, by regime; 13.6 imported | 20.00 | Compare with spirits and wine |
| Wine, USD per liter of pure alcohol | 2.4 local; 4.5 imported | 8.33 | Compare with beer |
| Spirits, USD per liter of pure alcohol | 7.5 (2023 rate; current not legible) | 7.50 | Compare with beer |
| Soft drinks, USD per liter | 0.10–0.50 by sugar (2023 rates; current not legible) | 0.45, flat | UK: GBP 0.21 and 0.28 by sugar (2026) |
| Standard lines covered, of 30 | 25 | 21 | — |
| Specific rates indexed to inflation | none | from 1 January 2027 | WHO: regular, ideally automatic |
8.2 What counts as an excise decides the revenue comparison
On a consistent definition both countries raise about the African mean, but the two figures rest on different evidence. Liberia’s excise law raised 0.37 percent of GDP in FY2024, about a quarter of the African mean of 1.32 percent in 2023 (OECD et al. 2025). But Liberia taxes fuel through earmarked Road Fund and refinery-company levies outside the excise law, and international revenue statistics count such levies as excises: in the OECD data, Liberia’s petroleum taxes and Road Fund fee are in the excise category, which totals 0.99 percent of GDP in 2023. Counting those levies and the motor vehicle levy, the diagnostic finds excise and excise-like levies of 1.25 percent of GDP in FY2024, close to the mean. The excise law alone describes about a third of Liberia’s system.
Sierra Leone’s collections differ from the public series by a factor of about two, and the diagnostic has not yet explained why. The diagnostic reports excise collected of 1.25–1.28 percent of GDP in 2024–25, nine-tenths of it from fuel. The OECD series records 0.57 percent in 2023, of which petroleum excise 0.34 percent and road user charges 0.15 percent, and 0.93 percent in 2021 (OECD et al. 2025). Fuel rate increases since 2023, a revision to GDP, or a difference in what is counted could each explain part of the gap. Reconciling collections across sources is one of the diagnostic’s own validation steps (Section 10.1), and for Sierra Leone it is open. Until it is closed, the Sierra Leone revenue figure should be read as the diagnostic’s estimate, not as a finding about the country’s tax effort.
8.3 What the two runs find
Sierra Leone raises most of its excise from fuel, on a large base rather than a high rate. Petrol pays USD 0.23 per liter, 16 percent of the pump price, about twice the carbon component of USD 0.11 at USD 50 a tonne and about half of it at USD 185. The Finance Act 2026 raised fuel rates by 79 to 147 percent, and at the new rates fuel would raise about 1.6 percent of GDP on the diagnostic’s estimate. Every non-fuel line together collected only 0.10–0.16 percent of GDP, although cigarettes, beer and sugar-sweetened beverages are all on the schedule.
The Sierra Leone run finds erosion by redenomination and incoherence across alcohol lines. When rates moved from US dollars to leones in 2024, beer rates fell about 70 percent and wine rates 70–90 percent in dollar terms; the 2026 act caught up on fuel and raised cigarettes by half, to USD 0.14 a pack, still about 14 percent of the retail price against WHO’s 70 percent target. Beer is taxed under two regimes, a specific rate and ad valorem bands for local content, whose rates differ by a factor of 1.3 to 4 depending on classification; imported beer and wine pay 50 to 140 percent more than local; wine pays less than beer per liter of pure alcohol; kerosene pays 40 percent of the diesel rate. The current spirits and soft-drink rates could not be read in the published law, so the report shows the last legible 2023 rates at the lowest data-quality score, as the quality rules of Section 6.2 require.
Liberia’s excise raises little because its largest bases sit outside the excise law. Fuel carries only the levies, worth USD 0.095 per liter, 7.3 percent of the June 2026 petrol price ceiling, and below the carbon cost alone at USD 50 a tonne before any air pollution, accident or congestion cost is counted. Plastics, mobile money, cement and edible oils are outside the excise law, and aviation fuel is exempt. Cigarettes pay USD 0.50 a pack, 27 percent of the last known retail price, yet the revenue authority booked no excise on imported tobacco in FY2024 or the first quarter of FY2025.
Liberia’s alcohol rates are inverted and unstable. Spirits pay USD 7.50 per liter of pure alcohol against USD 20.00 for beer, the same inversion as in Country A: the strongest drink pays least. The local spirits rate moved from USD 2.00 to 0.50 to 3.00 per liter in 16 months. The soft-drink rate of USD 0.45 per liter is flat, with no link to sugar, and above the UK’s top rate of GBP 0.28 at any exchange rate below 1.6 dollars per pound (HM Revenue and Customs 2026). Rates printed in US dollars do not erode with the Liberian dollar, and indexation is legislated from 1 January 2027. These rates read the latest amending act’s “Proposed” column as in force, an interpretation the run leaves open.
Both runs point to collection, not legislation, as the binding constraint outside fuel. Sierra Leone’s non-fuel lines together collect only 0.10–0.16 percent of GDP, and its run lists configuring excise on imports in the customs system among the open items; Liberia’s tobacco excise cannot be traced in the accounts. In both countries the most useful next steps the runs identify are administrative: publish legible schedules, book each excise line separately, and confirm which rates are in force. No reading of the schedule alone could have produced that finding; it comes from setting implied revenue beside collections.
The two runs report the three measures and the benchmarks but do not yet include a full externality spine. The comparison of fuel rates with the carbon component is the author’s calculation from the diagnostic’s measures. Whether Sierra Leone’s USD 0.23 also covers air pollution and accidents, as the Country A diesel example suggests it would not, is the question a full spine run would answer.
9 The strongest objections
The strongest economic objection is that a corrective benchmark is the wrong target where fuel taxes also pay for the state. The optimal fuel tax adds a revenue (Ramsey) component to the corrective one (Sandmo 1975; Parry and Small 2005), and in countries where income and consumption taxes are hard to collect that component can be large: fuel is imported through a few ports and taxed at a few depots. A ministry could read “petrol is at its corrective rate” as “petrol is taxed enough”. The answer is that the diagnostic reports the corrective rate as a floor, not a target. It is the part of the argument that holds whatever the government’s revenue needs, and it says so on the Level 1 page. A rate below the floor is too low on any view; a rate above it may still be right. The same applies to the health targets, which are shares of price set by WHO rather than valuations of damage.
The strongest practical objection is that the AI drafts are wrong too often to save time. The review stage corrected 16 of 49 entries in Sierra Leone and 14 in Liberia, and could not verify 4 and 2. A third of entries needing correction is consistent with published evidence that general-purpose language models often state legal facts wrongly and cannot tell when they do (Dahl et al. 2024). If every line must be checked against the gazette anyway, the objection runs, the model adds little. Three things answer it. First, the review is the method, not an add-on: the process does not let an unreviewed number reach Level 1, and the reference register shows what was checked. Second, the time saved is in the parts that do not need judgment: locating amendments, converting units and building the workbook. Third, the errors the pilots recorded, such as a missed finance act and a currency notation misread after a redenomination, are of a kind a human analyst also makes, and they were caught because the format forces a line-by-line check. What the objection does establish is that an unreviewed AI excise review should not be published.
A third objection is that a standard schedule flattens what is specific to each country. Thirty lines cannot hold every excise a country levies, and some national lines (a levy on a particular local spirit, a surcharge on one telecommunications service) map awkwardly. The diagnostic records every national line in Level 3 whether or not it maps, and records unmapped lines explicitly. The standard schedule serves comparison; the country schedule keeps the detail.
10 Validation, limits and use
10.1 How the diagnostic is checked
Validation runs at three levels: legal text, arithmetic and collections. Every legal line is checked against the gazetted source and given a status. Every computed number can be traced through the workbook to the parameter sheet, so a reviewer can recompute any Level 1 figure. Implied and reported revenue are reconciled with published collections: if the implied figure for fuel is 1.65 percent of GDP and collections are 1.2 percent, the gap is itself a finding, pointing to exemptions, arrears, smuggling or wrong volumes, and the report says which it cannot tell apart. The comparison with the OECD’s revenue series in Section 8.2 shows why this step matters and that it is not yet complete for Sierra Leone.
10.2 What it cannot do
The diagnostic is static. It does not model pass-through, demand response beyond a first-order correction, cross-border fuel smuggling or tobacco illicit trade. A ministry that wants revenue and emission projections should take the diagnostic’s rates and gaps into a model that has those responses, such as the Climate Policy Assessment Tool for fuels (Stretton 2026d), with the caution on its elasticities in Brief 5.4.
Implied revenue is approximate. Line-level volumes are the weakest input. Prevalence-based volumes include untaxed supply and overstate the base, and shares of consumer price move with the reference price. The data-quality score on each implied figure says how much to trust it.
Informal and home-produced goods sit outside the formal base. Opaque beer, home-distilled spirits and informally traded fuel are large in many lower-income countries. The diagnostic describes the formal base accurately and understates total consumption.
The externality spine is only as good as its weakest component. Air pollution exposure data at the spatial detail needed to attribute deaths to transport are missing in most low-income countries. Police accident records undercount road deaths, which is why WHO publishes modeled estimates by country (World Health Organization 2023b); the accident component should start from those estimates, not from police counts. Credible local fuel-price elasticities are rare, and the mileage share \(\beta\) is rarely estimated at all. The report surfaces these uncertainties as ranges and data-quality scores instead of burying them.
AI drafting introduces its own failure modes. A model can misread a scanned table, carry forward a superseded rate or produce a fluent paragraph that its own workbook does not support. The quality rules target exactly these failures. They work only if the human review is done, and no process can force a tired reviewer to read every line.
10.3 How a ministry uses it
The diagnostic is built to be run every year and read in a meeting. A tax policy unit can run it at each budget cycle, with the same standard schedule and the same spine, so that the change from last year shows on one page. It supplies what any budget or tax policy review needs on excise: the tax structure, the effective rates and their erosion, benchmarks against peers and targets, and the issues for policy dialogue.
The findings feed a reform sequence, which is a separate exercise. The sequence turns the diagnostic’s gaps into steps: what can be done by administrative indexation this year, what needs legislation, and what needs a compensation package first. Sequencing depends on political economy as much as on the size of each gap. Where a fuel tax is too salient to raise, other instruments can price part of the same damage: a feebate on new vehicles, as France has run since 2008, charges high emitters and rebates low ones without moving the pump price (Durrmeyer 2022; Stretton 2026b). The diagnostic’s contribution to that discussion is narrower and harder to argue with: it says where the system stands, against what, and how sure anyone can be.
The next step is a common regional table. Because every report maps onto the same 30 rows and uses the same spine, a set of country diagnostics stacks into a regional comparison with no further work, which a fiscal profile such as the indicators dashboard of paper 7.2 can then place in context (Stretton 2026a). Each new country makes the others more useful.
11 Conclusion
A ministry can now read its excise schedule whole, on comparable measures, against benchmarks it can defend, and with a record of how sure it can be of each number. The two country runs show what that buys: fuel taxes that are low against the carbon cost alone, alcohol taxes that charge the strongest drinks least, and health excises that are legislated but not collected. They also show the method’s main limitation. A third of the AI-drafted entries needed correction, and the revenue figure for one country does not yet reconcile with the public series. The next steps are to run the full externality spine on both countries, close the Sierra Leone reconciliation, and add countries until the regional table exists.
Downloads
References
Footnotes
This version condenses and replaces a 24,800-word draft (version 0.1, kept in the paper’s folder). The method was developed and piloted with country economists on three sub-Saharan African excise schedules; Section 8 reports the two pilots that were peer reviewed, Sierra Leone and Liberia, as illustrative results from the diagnostic, not official estimates. Errors are the author’s own.↩︎