The CPAT Mitigation Module: Methods in Brief
What a Finance Ministry’s Climate Model Computes, and How to Read Its Results
Finance ministries use the Climate Policy Assessment Tool, built by the World Bank and the IMF, to estimate what carbon taxes and fuel subsidy reform would raise, cost and cut. Its mitigation module is simple, but its documentation runs to 57,000 words and its 2023 edition contains twenty errors. A rebuild of the model states the whole method in fourteen equations. This brief explains what the model does, why a carbon price bites on coal far more than on road fuel, why power-sector results rest on two judgment calls, and how ministries and the teams who serve them should read and improve the results.
carbon pricing, climate policy models, finance ministries, energy demand, power sector
Climate Fiscal Policy Brief No. 5.1, October 2026. Stephen J. Stretton, writing in a personal capacity. The views expressed are the author’s own and do not represent those of any institution with which he is or has been affiliated. The full method, with every equation, the corrections and the derivations, is in the working paper.
Key messages
Read the full working paper → · Download this brief (pdf) · Slides (pdf)
A finance ministry should be able to audit the climate model it relies on, and CPAT’s mitigation module is small enough to audit. The whole module fits in fourteen equations, from fuel prices to revenue and growth.
A carbon price bites where fuel is cheap and carbon-rich. At 50 dollars per tonne of CO₂, CPAT’s default responses cut industrial coal use by about a third and road fuel use by about 6 percent.
Power-sector results rest on two judgment calls. New investment is shared by a rule whose key setting was chosen “subjectively”, and the growth of wind and solar is capped; under a large carbon price the caps often decide the answer.
The rebuild found real errors, and they are fixed. Rebuilding CPAT found 231 bugs in the legacy workbook and twenty errors in the 2023 documentation; the rebuilt model and a corrected edition of the documentation fix them.
Use CPAT as a first estimate for phased reforms, and say which results depend on judgment. Replace default settings with country evidence where it exists, and fund the three upgrades that matter most.
A model ministries rely on was hard to check
CPAT answers the four questions a finance minister asks about a carbon tax. How much will it raise, what will it do to fuel prices, how far will it cut emissions, and what will it do to growth? The Climate Policy Assessment Tool (CPAT), built jointly by the World Bank and the International Monetary Fund (IMF), answers all four for more than 180 countries. IMF staff have used it in Article IV reports, technical assistance and climate assessments, and World Bank teams in country work (Black et al. 2023; CPAT Team 2024). Its core is the mitigation module, which turns a policy into prices, fuel use, power investment, emissions, revenue and output.
Its documentation made it hard to know what the model assumes. The mitigation chapter alone runs to 57,000 words with seven appendices (CPAT Team 2024). A ministry economist who wanted to check a result had to assemble the method from tables, dashboard screenshots and equations, some of which were wrong. A model whose assumptions cannot be checked is hard to defend in a budget negotiation.
A rebuild has now stated the method in fourteen equations. The CPAT-AI project rebuilt the model twice, as a spreadsheet and in Python, wrote out every equation, and checked each against a running model (CPAT-AI Project 2026b). The working paper behind this brief states the corrected method in one place, with each correction noted (working paper, Appendix A).
The model is a short chain that every number can be traced through
Prices come first, and every part of them is explicit. The retail price of each fuel in each sector is the cost of supply, plus existing taxes, less subsidies, plus the new carbon charge and the value-added tax (VAT) on it. Because each part is separate, CPAT can report the total price signal on carbon, which Brief 6.1 turns into the Total Effective Carbon Price (Stretton 2026c). Where a country controls fuel prices, CPAT lets a floating tax or subsidy absorb world-price changes, but a positive tax never falls below its last observed level, so price rises in taxed fuels reach consumers (working paper, prices).
Fuel use then responds to income, an efficiency trend and the price. One equation covers every sector outside power. The price response has two parts: how much an existing car, boiler or furnace is used, and how efficient the stock becomes. Non-price policies such as efficiency standards and feebates act only on the second part, so they cut fuel use without raising the price paid per unit (working paper, demand).
An engineering power model meets electricity demand. It runs renewables and nuclear first, splits the rest between coal and gas on running cost, retires old plants, and shares new investment among technologies on full cost, including a charge for the storage that a high share of wind and solar needs (working paper, power).
Emissions and revenue follow by accounting, and revenue moves growth a year later. Emissions are fuel use times emission factors, calibrated to the national inventory. Revenue is fuel use times tax rates, net of the smaller base for existing fuel taxes. The change in revenue, and what the government does with it, moves output a year later through fiscal multipliers.
A carbon price bites on coal, not on road fuel
The same carbon price changes some fuel prices far more than others. A carbon charge adds a fixed amount per tonne of CO₂, so it is large relative to the price of a cheap, carbon-rich fuel and small relative to a heavily taxed one. At 50 dollars per tonne it more than doubles the price of industrial coal but adds only 10 to 13 percent to road fuel (Table 1).
| Fuel and sector | Price rise from the carbon charge | Fall in fuel use |
|---|---|---|
| Coal, industry | +118% | −36% |
| Natural gas, industry | +35% | −20% |
| Diesel, road transport | +13% | −6% |
| Gasoline, road transport | +10% | −6% |
So most of the percentage cut comes from coal. Industrial coal use falls by about a third and road fuel by about 6 percent, for similar responsiveness. The tonnes depend on each country’s fuel mix, but a country that burns coal will find most of its cut there.
Each fuel responds to its own price alone. Outside power, cooking and road vehicles, CPAT has no fuel switching: a carbon price that raises coal more than gas cuts coal more than gas, but does not move a factory from coal to gas. The model therefore understates switching in industry and overstates the fall in total energy use. Paper 6.1 shows how a richer demand system with switching changes the result (Brief 6.1).
The responses are long-run, but the model applies them within a year. CPAT’s elasticities were set from a meta-analysis of price responses (Labandeira et al. 2017) and adjusted for developing countries, and they are long-run values. The model applies them to each year’s price change, so a sudden price jump produces its full long-run response at once (Black et al. 2023). For a carbon price phased in over several years, which is the usual design, the error is small; for a sudden shock it is not. Paper 5.4 checks the elasticities against the wider evidence (Brief 5.4).
Power-sector results rest on two judgment calls
New power investment is shared by a rule whose key setting was chosen by judgment. CPAT shares new investment among technologies by a “logit” rule: cheaper technologies get more, but every permitted technology gets something. How sharply cost differences translate into shares is set by one parameter, which the documentation says was “set subjectively at 2” (CPAT Team 2024). It has never been estimated.
The second judgment call is a cap on how fast each technology can grow. Wind and solar can each add about 2 percentage points of the power system a year in most countries. Under a large carbon price the cap, not the price, often decides how fast the system changes. A ministry reading CPAT’s power results should ask whether the caps bind.
The investment rule has an economic meaning, and a simpler alternative exists. The working paper shows that CPAT’s rule is what a planner would choose if it minimized cost while paying a penalty for concentrating investment, with the penalty worth about 22 dollars per megawatt-hour in a stylized example. Changing the shape of that penalty gives a rule with a simple formula that a ministry can check by hand, and that gives uncompetitive technologies nothing (working paper, penalty-based allocation). Figure 1 compares the two. With no carbon price CPAT’s rule still gives oil-fired power 1.4 percent of new investment at more than two and a half times the cost of solar; the alternative gives it none. At 75 dollars per tonne the alternative stops investment in coal; CPAT’s rule keeps 1 percent.
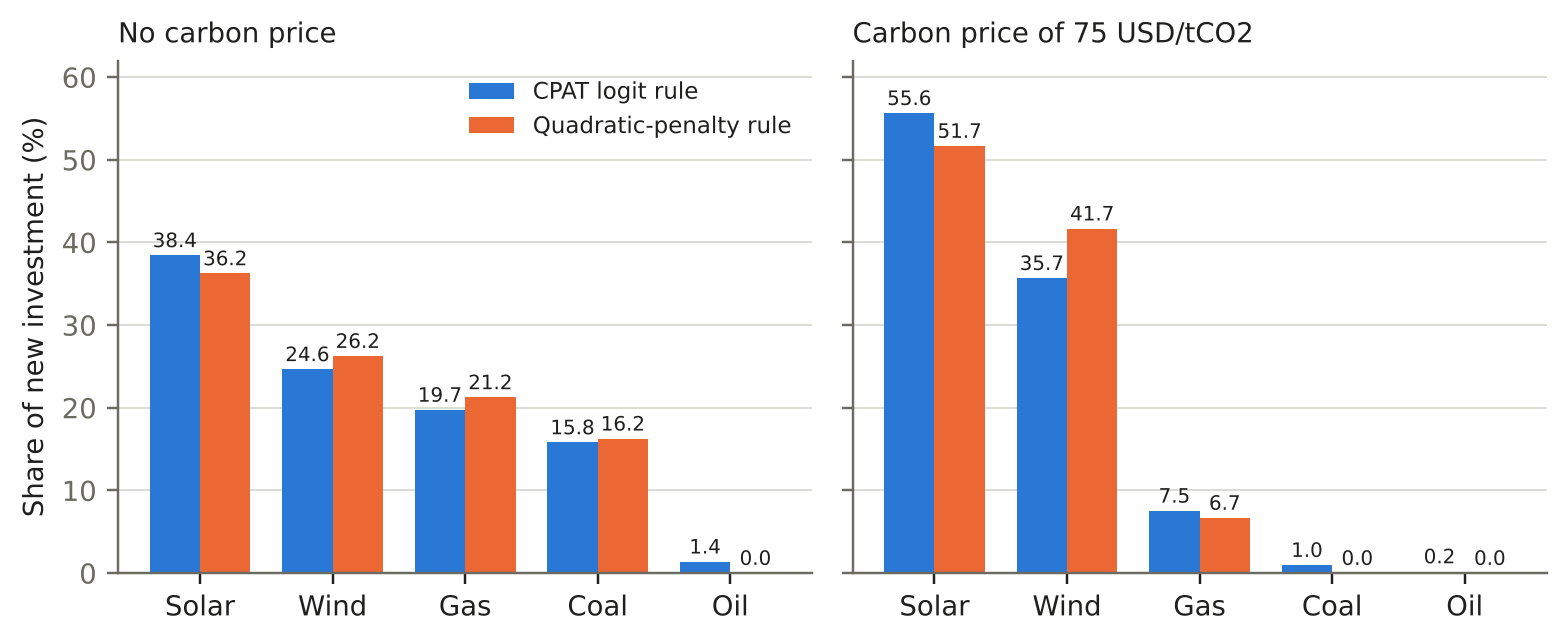
Neither rule is right in general. Both need a parameter fitted to observed investment. The case for the alternative is transparency, not accuracy, so it should be tested behind a switch before any change to the default.
The rebuild found real errors, and they are fixed
The legacy workbook had 231 bugs, and none is carried into the rebuilt model. The rebuild follows one rule: a bug, where the workbook does not compute what it means to, is fixed and never copied; an issue, where it computes what it means to but the choice is open to question, is copied and tracked (CPAT-AI Project 2026b). Some bugs changed results. The workbook added each year’s growth effect of a policy to the growth rate every year, so a one-off effect on output compounded; it sized new power plants for this year’s demand although they come online next year; and it computed the effect of efficiency regulations but never applied it.
The 2023 documentation had twenty errors, now corrected. They include a wrong sign on the electricity price markup, a wrong discount factor in the cost of power, and no equation at all for how revenue moves output. None changes the model, but a reader of the 2023 text would get these equations wrong. A corrected edition was published on 31 October 2026, fourteen errors fixed in full and six in part (CPAT-AI Project 2026a); the public site still carries the 2023 text.
Read CPAT as a first estimate for phased reforms
The strongest objection is that a model this simple should not guide fiscal decisions. It has no lags, little fuel switching, a fixed world fuel market, no trade and a power sector that rests on judgment. The answer is that its biases mostly have known signs, its price responses are checked against the evidence, and it is built for phased, medium-term reforms, where the missing dynamics matter least (working paper, limitations). Paper 5.3 sets out how its results compare with other models and with history (Brief 5.3).
Some results deserve more caution than others. The first-year response to a sudden price jump is overstated. Switching from coal to gas in industry is missed. Population growth is treated like rising income, which misstates baseline demand where populations grow fast. A carbon price in a large economy would move world fuel prices, which CPAT holds fixed. And the power path under a large carbon price is set mainly by the build-rate caps.
What to do
Finance ministries: ask for the price changes before the quantities, and for the assumptions that set them. A CPAT result is only as good as the price change behind it and the elasticity applied to it. Ask whether the base year matches national data, which defaults were replaced with country evidence, and whether the power result depends on the build-rate caps.
World Bank and IMF teams running CPAT: replace defaults with country evidence and say which results rest on judgment. Use a national power plan where one exists, country elasticities where they have been estimated, and national multipliers where available. Report results from the corrected model, and cite the corrected documentation rather than the 2023 text.
The CPAT team: fund the three upgrades that matter most. Estimate the investment rule’s parameter from observed investment, or test the quadratic-penalty rule behind a switch. Add gradual adjustment and fuel switching to the demand equation, along the lines of Paper 6.1. And extend the rebuilt model’s data from one country to all, so that ministries everywhere get the corrected method.