The CBAM Policy Tool
Measuring Exporters’ Exposure to the EU Carbon Border Adjustment and What Domestic Policy Can Do About It
Since January 2026, importers of steel, aluminum, cement, fertilizers, hydrogen and electricity into the European Union have owed a carbon charge on the emissions embedded in what they buy. For many middle-income exporters the charge is large, it rises to 2034, and it depends on choices their own governments control: whether producers file verified emissions data and whether the country prices carbon at home. This paper describes a spreadsheet tool that computes the exposure product by product and year by year, sets out its method in five equations, and applies it with public data. At €80 per tonne of carbon dioxide, Turkish hot-rolled steel declared at the default value owes about €107 per tonne in 2026 and €252 at full phase-in, close to half its import price. For seven Egyptian exports the full-phase-in charge is about €793 million a year at default values and €480 million with verified data at 2025 volumes. Verified data are the decisive lever for steel; for urea, the largest exposure, only abatement or a domestic carbon price moves the charge much.
carbon border adjustment, CBAM, embedded emissions, default values, carbon pricing, trade exposure
Working paper, version 0.2, October 2026. Stephen J. Stretton, writing in a personal capacity. The views expressed are the author’s own and do not represent those of any institution with which he is or has been affiliated. A short version for policy makers is Climate Fiscal Policy Brief No. 6.2. Companion paper to the Climate Fiscal AI Tools.1
1 Executive summary
Policy brief (short version) → · Download this paper (pdf) · Slides (pdf)
The EU now charges importers for the carbon in steel, aluminum, cement and fertilizers, and the bill depends on decisions exporting governments control. Since January 2026, importers of these goods, and of hydrogen and electricity, have owed certificates for the emissions embedded in what they buy, priced in line with the EU’s emissions trading system. The charge rises each year to 2034 as the EU’s own producers lose their free allowances. How much an exporter pays depends on three things its government can influence: whether its plants file verified emissions data instead of the EU’s default values, whether they cut emissions, and whether the country levies a carbon price at home that the EU deducts.
The CBAM Policy Tool turns these rules into a product-by-product, year-by-year bill that a ministry can check. For each covered product of one exporting country it builds embedded emissions from energy use and process chemistry, compares them with the EU’s default values, applies the phase-in and the certificate price year by year, and deducts a domestic carbon price where the rules allow. A second module lets a domestic carbon price change output and emissions, and splits the fall in the border charge into the part from cleaner production and the part from the deduction.
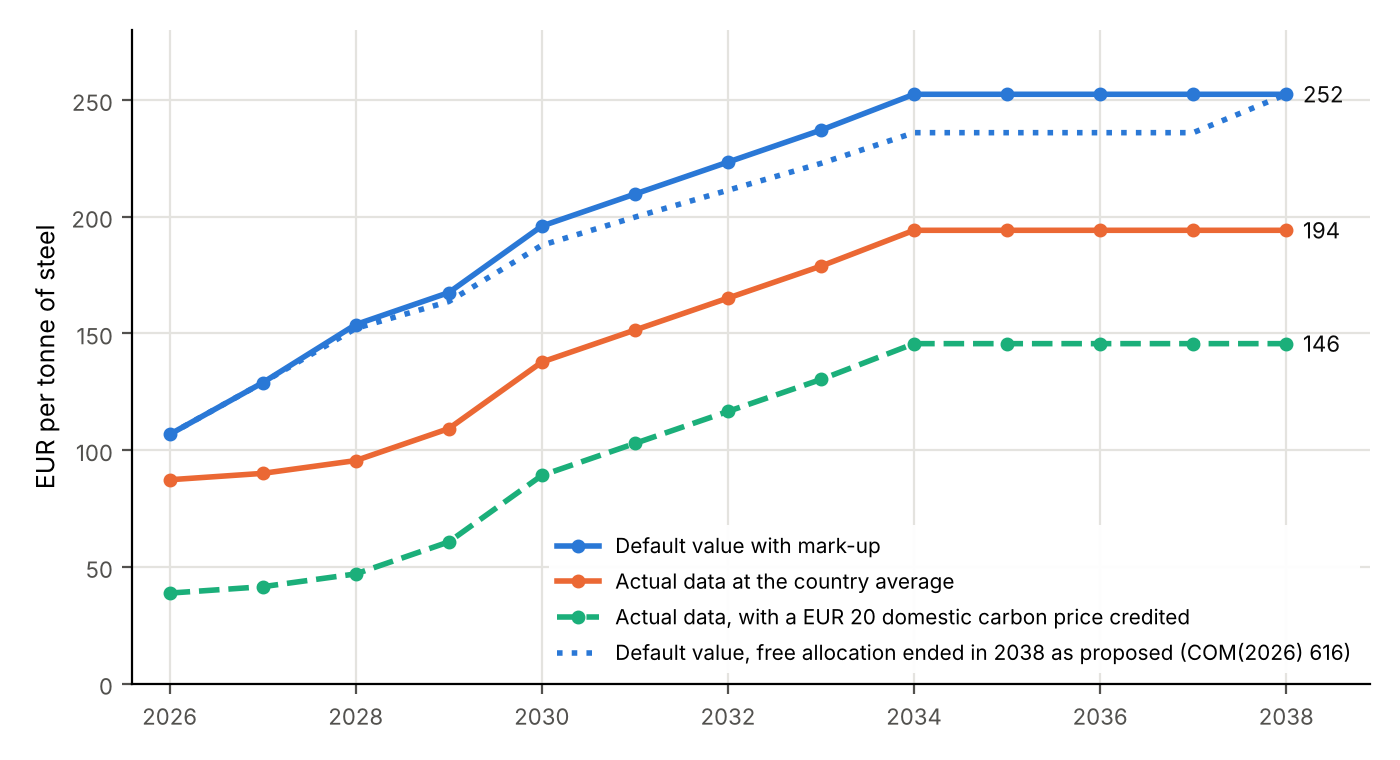
For goods far dirtier than the EU’s benchmark, most of the charge arrives in the first year. At €80 per tonne of CO₂, Turkish hot-rolled steel declared at the default value owes about €107 per tonne in 2026, €196 in 2030 and €252 at full phase-in, close to half its 2025 import price of €549 per tonne. The 2026 charge is already 42 percent of the final one, because the phase-in only covers emissions up to the benchmark. A Commission proposal of July 2026, not yet adopted, would end free allocation in 2038 instead of 2034, lowering the 2034 charge to €236.
Verified data and a domestic carbon price are each worth tens of euros a tonne. For the Turkish steel, filing verified data at the country average avoids the 30 percent mark-up on the default, worth €58 per tonne at full phase-in. A domestic carbon price of €20 per tonne of CO₂, effectively paid and deducted, cuts the charge by another €49 and collects the same sum at home. At 2025 volumes, a €20 price on the three Turkish goods in the example would move about €127 million a year from the EU budget to Türkiye’s.
Egypt shows that the right lever differs by product. Egypt has no EU default of its own for steel, so its gas-based and scrap-based steel is charged at a value set from the most carbon-intensive exporters, more than five times the tool’s estimate. Corrected to the CBAM accounting rules and using Eurostat’s 2025 trade, seven Egyptian exports would owe about €793 million a year at full phase-in at default values, and €480 million with verified data. Most of the saving is on steel (€178 million) and clinker (€84 million). Urea, the largest exposure at €369 million, gains only €48 million from data, because the EU’s default for Egyptian urea is close to what its plants emit; there, only abatement or a credited domestic carbon price moves the bill much.
The tool also shows what the current rules do not reward. A carbon price whose revenue is rebated to producers, such as a feebate, keeps the incentive to cut emissions per tonne but, under the Commission’s draft rules, earns no deduction at the border. And measuring plant by plant lets a firm route its clean output to the EU without cutting emissions, a gain that measuring by country and sector removes (Brief 1.4).
What to do. Exporting ministries should run the calculation for their own products before choosing a policy: build verification capacity where the default is far above what plants emit, as for Egyptian steel; consider a domestic carbon price where it is not, as for Egyptian urea; and press the Commission, in the 2027 revision of default values and in its rules on deductions, to credit price signals rather than only payments. The tool computes exposure, not who bears it, and its estimates are technology averages; plant data must confirm them.
2 Introduction
The EU’s Carbon Border Adjustment Mechanism (CBAM) turns a trading partner’s domestic climate policy into a line in either the EU’s budget or its own. Since 1 January 2026, importers of iron and steel, aluminum, cement, fertilizers, hydrogen and electricity have owed certificates for the emissions embedded in their imports, priced in line with the EU Emissions Trading System, with certificate sales from February 2027 (European Parliament and Council of the European Union 2023b, 2025). At €80 per tonne of carbon dioxide (CO₂) and full phase-in, a tonne of hot-rolled steel from Türkiye declared at the Commission’s default value carries a charge of €252, about 46 percent of its average 2025 import price (Section 7). The charge falls if the exporter files verified emissions data below the default, if its plants cut emissions, or if its government levies a carbon price that the EU deducts. A finance or trade ministry needs to know how large the exposure is, how it rises to 2034, and which of these levers moves it most for each of its products.
This paper describes a tool built to answer those questions and shows what it does with public data. The CBAM Policy Tool is a spreadsheet that, for each covered product of one exporting country, builds embedded emissions from energy use and process chemistry, compares them with the EU’s default values, applies the free-allocation adjustment, the mark-ups and the certificate price year by year, and deducts a domestic carbon price where the rules allow. A second module lets a domestic carbon price change output and emissions per tonne and splits the resulting fall in the border charge into the part from abatement and the part from the deduction.
Four results stand out. First, emissions above the CBAM benchmark are charged in full from the first year, so for carbon-intensive goods most of the exposure arrives in 2026, not 2034: on Turkish hot-rolled steel declared at the default, the charge is €107 per tonne in 2026 and €196 in 2030 at €80 (Table 3). Second, the mark-up on default values is worth €58 per tonne at full phase-in for that product, the most a producer at the country average gains by filing verified data. Third, a domestic carbon price deducted under Article 9 lowers the charge one for one with the price paid and moves the money from the EU to the exporter’s treasury: a hypothetical €20 price on the three goods in the example would move about €127 million a year at 2025 volumes. Fourth, the best lever differs by product. For Egypt, which has no EU default of its own for steel, verified data would cut the charge on steel by about 90 percent; for urea, Egypt’s largest CBAM export to the EU, the default is close to the tool’s estimate, and only abatement or a domestic price moves the charge much (Section 8).
The closest prior work computes CBAM liabilities by exporting country from the Commission’s default values. Assous et al. (2024) do so for China and other exporters at full phase-in, including a scenario in which exporters route low-carbon output to the EU; paper 1.4 of this series calibrates the charge on steel across thirteen exporters and shows that measuring by country and sector removes the gain from such routing (Stretton 2026c, 2026d). Trade-model studies estimate who bears the charge across countries (Eicke et al. 2021; Beaufils et al. 2023; Magacho et al. 2024; Perdana and Vielle 2022), and a design literature argues how a border adjustment should work (Mehling et al. 2019; Mehling and Ritz 2023; Keen et al. 2022). The tool adds three things a ministry needs and these do not give: a bottom-up estimate of what verified data would show, set against the default product by product; the year-by-year path, with the free-allocation adjustment under current law and under the July 2026 proposal; and the split of a domestic price’s effect into abatement and deduction. It also implements the producer-side track of the two-track architecture in paper 1.1 (Stretton 2026g, 2026h), so a ministry can see in its own numbers what those papers argue.
3 What CBAM charges
The importer surrenders certificates for embedded emissions above the free allocation that EU producers still receive, less a deduction for carbon prices paid abroad. Embedded emissions are declared either from actual values, verified at the installation, or from default values set by the Commission (European Parliament and Council of the European Union 2023b, Art. 7; European Commission 2025b, 2025a). For iron, steel and aluminum only direct emissions count; for cement and fertilizers indirect emissions from electricity count too (European Parliament and Council of the European Union 2023b, Annex II). Importers below a single threshold of 50 tonnes a year across these goods owe nothing (European Parliament and Council of the European Union 2025, Annex VII). Table 1 lists the parameters the tool needs and where each comes from.
| Parameter | Rule | Source |
|---|---|---|
| Coverage | Iron and steel, aluminum, cement, fertilizers, hydrogen, electricity, by CN code; importers below 50 tonnes a year exempt | European Parliament and Council of the European Union (2023b), Annex I; European Parliament and Council of the European Union (2025), Annex VII |
| Embedded emissions | Actual (verified) or default values; direct only for iron, steel and aluminum | European Parliament and Council of the European Union (2023b), Annex II; European Commission (2025b) |
| Default values | Country averages by CN code, with mark-ups of 10% (2026), 20% (2027) and 30% (2028 on); 1% for fertilizers | European Parliament and Council of the European Union (2025), Annex IV; European Commission (2025e) |
| Free-allocation adjustment | Benchmark by CN code and production route, times the CBAM factor (the share of free allocation EU producers keep: 97.5% in 2026, 51.5% in 2030, 14% in 2033, zero from 2034), times the cross-sectoral correction factor | European Commission (2025d), Annex points 3–5; European Parliament and Council of the European Union (2023a) |
| Certificate price | Set from EU allowance auction prices, by implementing act | European Commission (2025c) |
| Deduction for carbon price paid | Price “effectively paid” at origin, net of any rebate or compensation, where actual emissions are declared; for default values, only a default carbon price the Commission may publish from 2027 for countries with carbon pricing rules | European Parliament and Council of the European Union (2025), Art. 9 |
Default values are country averages with a penalty on top, so data pay for cleaner plants. Since the 2025 amendment, a default value is the average emission intensity of the exporting country, raised by a mark-up; where reliable data are lacking, it is the average of the ten most intensive exporting countries (European Parliament and Council of the European Union 2025, Annex IV point 4.1, recital 35). The Commission’s values for 2026 cover 119 countries and a residual “other countries” category, by CN code, with a production-route code that sets the benchmark for the free-allocation adjustment (European Commission 2025e, 2026b). Implementing Regulation (EU) 2026/1740 of 20 July 2026 corrected some values retroactively from 1 January 2026 (European Commission 2026a); it leaves unchanged the Türkiye values used below. The defaults are to be revised in 2027 at the latest (European Commission 2025e, Art. 2).
The deduction rules decide whether a domestic carbon price keeps money at home. Under Article 9 as replaced in 2025, a declarant using actual emissions may deduct a carbon price “effectively paid” in the country of origin, net of “any rebate or other form of compensation”; a declarant using default values may deduct only a default carbon price, which the Commission “may” publish from 2027 for countries with carbon pricing rules (European Parliament and Council of the European Union 2025, Art. 9(1), 9(4)). The Commission’s draft implementing rules count emissions “below an emission intensity baseline” as compensation to be netted off (European Commission 2026c, Art. 8(1)(b)(ii)), so a revenue-neutral feebate or a fully rebated carbon price earns no deduction. Paper 1.4 analyzes this rule and proposes to credit the price signal instead (Stretton 2026c, 2026d, 2026e).
4 What the tool does
The tool answers three questions for one exporting country: how large is the CBAM charge on each product each year, how much would verified data save, and what would a domestic carbon price do to it. It is an Excel workbook built so that every input sits in a labeled cell with its source and every result can be traced to its inputs by formula. Two versions exist. The exposure version covers ten CBAM product groups (four steel routes, grey clinker, ammonia, urea, ammonium nitrate, other nitrogen fertilizers and primary aluminum) for a set of countries over 2024–2035, with switches for which emission scopes count, whether verified data are filed and whether a domestic price applies to exports only or to all production. The policy version takes one country’s CBAM goods and simulates a domestic carbon price, with switches for whether process emissions are priced, whether revenue is rebated per unit of output and whether it finances an abatement fund.
Each run returns a small set of results. For the chosen country and year the tool reports: embedded emissions per tonne by component and in total; the gap between those emissions and the EU default; the CBAM charge per tonne and in total at projected export volumes; the domestic carbon price at which the charge would be fully deducted; and the revenue a domestic price would raise on EU exports, other exports and domestic sales. The policy version adds the change in the charge per tonne, split into the part from cleaner production and the part from the deduction, and the change in emissions of the CBAM goods, split into output and intensity. Hydrogen, electricity and the downstream goods proposed in December 2025 (European Commission 2025f) are outside the current version.
The first application built a full emission-factor matrix for Egypt. For Egypt’s CBAM exports the tool was paired with an emission-factor workbook that shows the same products at two levels: headline products and, beneath them, about two dozen CN-code lines weighted by their share of the product’s EU exports, with a check that rebuilds each product from its lines. Each component of each factor carries a confidence flag (authoritative, estimated split, or proxy) and each product a quality-assurance line naming its largest uncertainty and the verification that would resolve it (CBAM Policy Tool 2026). Section 8 reports what it shows, after two corrections to its fertilizer accounting described in Appendix A.
5 Method
5.1 Embedded emissions from the bottom up
Embedded emissions per tonne are built from energy use, process chemistry and electricity, in the same components the EU uses. For product \(i\) the tool computes direct emissions per tonne as \[ e_i^{\mathrm{dir}} = \sum_k h^{c}_{ik}\,\phi_k + \sum_k h^{p}_{ik}\,\phi_k + e^{np}_i + e^{no}_i , \tag{1}\] where \(h^{c}_{ik}\) is fuel \(k\) burned for heat (GJ per tonne), \(h^{p}_{ik}\) fuel \(k\) used as a reductant or feedstock, such as natural gas in direct reduction of iron or in an ammonia reformer, \(\phi_k\) the fuel’s CO₂ emission factor (for example 56.1 kg per GJ for natural gas and 74.1 for gas oil (IPCC 2006)), \(e^{np}_i\) non-fuel process CO₂ (limestone calcination in clinker, anode consumption in aluminum) and \(e^{no}_i\) non-CO₂ gases in CO₂ equivalents (nitrous oxide from nitric acid, perfluorocarbons from smelting). Indirect emissions are electricity use times the grid emission factor, \(e^{\mathrm{ind}}_i = u_i\,g\). The CBAM-relevant intensity is \(e_i = e^{\mathrm{dir}}_i\) for steel and aluminum and \(e^{\mathrm{dir}}_i + e^{\mathrm{ind}}_i\) for cement and fertilizers.
Precursors are integrated into the goods made from them, and CO₂ used in a product counts as emitted unless it stays bound. Urea and ammonium nitrate are made from ammonia, which the EU treats as a precursor whose emissions are embedded in the downstream good (European Commission 2025b). A tonne of urea contains 0.567 tonnes of ammonia from its molecular formula; a tonne of ammonium nitrate embeds 0.425 tonnes, half directly and half through nitric acid, itself a precursor made from ammonia. Each is multiplied by ammonia’s own intensity, and only net merchant ammonia is counted as standalone ammonia. The CO₂ that urea synthesis takes up is not deducted: the EU’s monitoring rules let CO₂ used in a product count as not emitted only where it is “permanently chemically bound so that it does not enter the atmosphere under normal use” (European Commission 2025b, Annex II point B.8.2), and urea releases it when applied to soil (De Klein et al. 2006, sec. 11.4). The Commission’s default for Egyptian urea, 1.32 tCO₂ per tonne direct, is consistent with this accounting: 0.567 times Egypt’s ammonia default of 1.96, plus the urea plant’s own fuel (European Commission 2026b).
The bottom-up intensity is the tool’s estimate of what verified data would show for a plant at the technology average. Comparing it with the default value tells a ministry where filing data pays. Where the estimate is below the marked-up default, producers gain from verification; where it is above, the default is a subsidy to the dirtiest plants and the producer keeps it. A verified declaration follows the installation’s own monitoring under the EU rules, so the estimate is a guide to where to look, not a substitute (Section 10).
5.2 The charge per tonne
The charge per tonne is the certificate price times embedded emissions above the free-allocation adjustment, less any deducted carbon price. Let \(e_i\) be the declared embedded emissions, \(\bar e_{c,i}\) the country default before mark-up and \(m_t\) the mark-up, so that \(e_i = (1+m_t)\bar e_{c,i}\) under default values. Let \(B_i\) be the CBAM benchmark for the product’s route, \(f_t\) the CBAM factor in year \(t\) (0.975 in 2026, zero from 2034), \(P_t\) the certificate price and \(\tau^d\) the domestic carbon price effectively paid per tonne of CO₂. The charge per tonne of product is \[ C_{it} = \max\Big\{0,\; P_t\big[e_i - f_t B_i\big]^{+} - \tau^d e_i\Big\}. \tag{2}\] The deduction \(\tau^d e_i\) is the form the Commission’s draft implementing regulation gives: the reduction in certificates equals the effective carbon price per tonne of good divided by the certificate reference price, with no adjustment for free allocation (European Commission 2026c, Art. 6). The draft was in the Commission’s adoption workflow, not adopted, on 31 October 2026; the floor at zero is this paper’s assumption. Two simplifications affect only 2026–2033: the free-allocation adjustment in Implementing Regulation 2025/2620 also multiplies by a cross-sectoral correction factor, set to 1 here; and a declarant using actual data builds the adjustment from process benchmarks and the free allocation embedded in its precursors, which the example approximates with the default benchmark (European Commission 2025d, Annex points 3–4).
Emissions above the benchmark are charged in full from the first year. Because \(f_t B_i\) is at most the benchmark, the term \(P_t(e_i - f_t B_i)\) is at least \(P_t(e_i - B_i)\) in every year. For a good whose embedded emissions are far above the benchmark, most of the charge applies in 2026 and the phase-in adds only the benchmark’s share. For a good close to the benchmark the charge starts near zero and rises with \(1-f_t\). The phase-in therefore protects efficient exporters, not inefficient ones.
The capture price is the domestic carbon price that would reduce the charge to zero. Setting \(C_{it} = 0\) in equation 2 gives \[ \tau^{d*}_{it} = P_t\,\frac{\big[e_i - f_t B_i\big]^{+}}{e_i}. \tag{3}\] At full phase-in the capture price equals the certificate price. Before 2034 it is lower, because part of the embedded emissions is covered by the free-allocation adjustment. A domestic price at \(\tau^{d*}\) moves the whole charge from the EU budget to the exporter’s treasury while leaving EU buyers’ costs unchanged; it also raises revenue on all other sales the price covers, which for an exporter selling most of its output at home or outside the EU is the larger sum (Stretton 2026g).
5.3 A domestic carbon price: abatement and deduction
In the policy version, a domestic carbon price changes output, emissions per tonne and the deduction. For product \(i\) with price \(p_i\) and carbon cost share \(\delta_i = (1-\theta)\tau\,e_i/p_i\), where \(\theta\) is the share of the carbon cost rebated per unit of output, output falls along a constant-elasticity curve, \(Q_i = Q^0_i(1+\delta_i)^{\varepsilon_i}\), with small elasticities \(\varepsilon_i\) for traded goods. Fuel emissions per tonne fall with a semi-elasticity, \(e^{f}_i = e^{f0}_i\exp(-\beta^{f}\tau)\), and process emissions per tonne with product-specific semi-elasticities \(\beta^{p}_i\). The fuel response is calibrated to the industrial fuel response of the Climate Policy Assessment Tool, net of its output effect, which links the tool to the elasticities checked in paper 5.4 (Stretton 2026b, 2026a); the process semi-elasticities are the tool’s assumptions. A partial-adjustment block scales the long-run responses for a price that has been in force only a few years.
The fall in the charge splits into abatement and deduction. At full phase-in, without rebates and with the domestic price covering all embedded emissions, equation 2 gives \(C = (P - \tau^d)e\). If the domestic price cuts the export-weighted intensity by a fraction \(r\), the proportional change in the charge is \[ \frac{\Delta C}{C^0} = -\,r \;-\; (1-r)\,\frac{\tau^d}{P}. \tag{4}\] The first term is cleaner production; the second is the deduction. With \(\tau^d = €20\), \(P = €80\) and an intensity cut of 10 percent, the charge falls by 32.5 percent, of which 22.5 points come from the deduction. For a modest domestic price, the deduction does more for the border charge than abatement does. With a full output-based rebate (\(\theta = 1\)), the marginal incentive survives but, under the draft rules on compensation, the deduction disappears, so only the first term remains (Stretton 2026c). An abatement fund financed by the price keeps the deduction if it meets the draft’s four conditions for revenue-financed subsidies (European Commission 2026c, Art. 8(2)) and adds abatement.
6 Data
Every input the method needs is public, and the tool records the source of each. Table 2 lists the inputs and the public sources the tool uses or can use. Country-specific engineering data, such as natural gas use per tonne of direct reduced iron, are the least certain inputs; the tool flags them and reports a range where the evidence allows.
| Input | Unit | Public source |
|---|---|---|
| Default values, mark-ups, route codes | tCO₂e per tonne | European Commission (2025e); European Commission (2026b) |
| CBAM benchmarks | tCO₂e per tonne | European Commission (2025d) |
| CBAM factor (free-allocation phase-out) | share | European Parliament and Council of the European Union (2023a); proposal European Commission (2026d) |
| Certificate price | € per tCO₂ | EU allowance auction prices (European Commission 2025c); scenarios |
| EU imports by CN code and partner | tonnes, € | Eurostat Comext (Eurostat 2026); UN Comtrade for other destinations |
| Production by product | tonnes | Industry associations and national statistics (steel, cement, fertilizer, aluminum) |
| Energy and process intensities | GJ or tCO₂ per tonne | Sector benchmarks, national energy balances |
| Fuel emission factors, process factors, global warming potentials | kg CO₂ per GJ; tCO₂e per tonne | IPCC (2006) and IPCC assessment values |
| Grid emission factors | tCO₂ per MWh | National and international energy statistics |
| Growth of output | percent a year | IMF growth projections, scaled by an output elasticity |
7 A worked example: three Turkish exports
The example uses only public data: the Commission’s default values for Türkiye and Eurostat’s record of EU imports from Türkiye in 2025. Türkiye is a large exporter of steel to the EU and has country-specific default values for its main steel products. The example takes three goods: hot-rolled flat steel (CN 7208), reinforcing bar (CN 7214 20 00) and unwrought aluminum (CN 7601). Their direct default values before mark-up are 2.43, 2.31 and 1.70 tCO₂ per tonne, on production routes (C), blast furnace carbon steel, and (K), primary aluminum (European Commission 2026b). In 2025 the EU imported 2.10 million tonnes of the hot-rolled steel from Türkiye, worth €1,154 million; 0.50 million tonnes of rebar, worth €259 million; and 52,000 tonnes of unwrought aluminum, worth €142 million (Eurostat 2026). The certificate price is a stylized €80, as in paper 1.4. The default CBAM benchmarks are 1.370 tCO₂ per tonne for hot-rolled flat steel and 1.364 for rebar on route (C), and 1.423 for unwrought aluminum on route (K) (European Commission 2025d, Annex point 5.3); they affect 2026–2033 but not full phase-in.
2.Source/cbam_example.py.
| Product | Year | Default with mark-up (tCO₂/t) | Charge at default (€/t) | Share of 2025 unit value | Charge at default, COM(2026) 616 (€/t) | Charge, actual data at country average (€/t) | Charge, actual data with €20 deducted (€/t) |
|---|---|---|---|---|---|---|---|
| Hot-rolled flat steel (€549/t) | 2026 | 2.67 | 107 | 19% | 107 | 87 | 39 |
| 2030 | 3.16 | 196 | 36% | 188 | 138 | 89 | |
| 2034 | 3.16 | 252 | 46% | 236 | 194 | 146 | |
| Rebar (€523/t) | 2026 | 2.54 | 97 | 19% | 97 | 78 | 32 |
| 2030 | 3.00 | 184 | 35% | 176 | 129 | 82 | |
| 2034 | 3.00 | 240 | 46% | 224 | 185 | 139 | |
| Unwrought aluminum (€2,744/t) | 2026 | 1.87 | 39 | 1% | 39 | 25 | 0 |
| 2030 | 2.21 | 118 | 4% | 110 | 77 | 43 | |
| 2034 | 2.21 | 177 | 6% | 160 | 136 | 102 |
On steel declared at the default, the charge is large from the first year and reaches almost half the import price. Table 3 shows that hot-rolled steel declared at the marked-up default would owe €107 per tonne in 2026, €196 in 2030 and €252 at full phase-in, against an average 2025 import price of €549 per tonne. Rebar follows the same path. The 2026 charge is already 42 percent of the full-phase-in charge, because Türkiye’s default for these products is well above the route (C) benchmark, so most embedded emissions are above the free-allocation adjustment from the start (Section 5.2). For aluminum the charge is a small share of a much higher price. If the July 2026 proposal were adopted, the 2030 charge on hot-rolled steel would be €188 instead of €196, and the charge would stay at €236 from 2034 to 2037 before reaching €252 in 2038 (Figure 1).
2.Source/cbam_example.py.
Filing verified data at the country average saves €58 per tonne of steel at full phase-in; a €20 domestic price saves another €49. The mark-up is what a producer at the country average avoids by filing data: 30 percent of 2.43 tCO₂ at €80, or €58 per tonne of hot-rolled steel. A producer cleaner than average gains more. A domestic carbon price of €20 effectively paid on all embedded emissions lowers the charge by €20 × 2.43 = €49 per tonne, and the same €49 is collected at home. Together the two levers cut the full-phase-in charge on hot-rolled steel from €252 to €146 per tonne, by 42 percent.
At 2025 volumes, the three goods would owe about €660 million a year at full phase-in under default values, and a €20 domestic price would move €127 million of the charge home. The default-value charge at full phase-in sums to €531 million on hot-rolled steel, €119 million on rebar and €9 million on aluminum, against imports worth €1,555 million. Filing data at the country average lowers the total to €507 million; adding the €20 deduction lowers it to €380 million, while the domestic price raises €127 million from the same exports. The capture price of equation 3 is €80 at full phase-in; at that price the whole charge on these goods, about €507 million, would be collected in Türkiye instead of the EU, on top of what the price raised on domestic sales and other exports. Volumes are held at 2025 levels and the €80 price is stylized; the example shows the scale and the mechanics, not a forecast.
8 A country application: Egypt
The tool’s Egypt application compares bottom-up emission factors for Egypt’s CBAM exports with the defaults the EU applies, and for steel and cement the gaps are large. The application builds each factor from the components of equation 1, using IPCC constants, sector energy intensities and Egypt’s production routes (CBAM Policy Tool 2026). Egypt makes its steel in electric arc furnaces, from gas-based direct reduced iron and from scrap; its old integrated plant at Helwan was put into liquidation in January 2021 (Amwal Al Ghad 2021). It also exports clinker, ammonia, urea, ammonium nitrate and primary aluminum to the EU. Table 4 sets the tool’s estimate for seven products, corrected to the CBAM accounting rules (Appendix A), against the Commission’s default values (European Commission 2026b), at the volumes the EU recorded in 2025 (Eurostat 2026). These are illustrative results from the tool, not official estimates.
2.Source/egypt_example.py.
| Product (CN) | EU imports, 2025 (kt) | Tool estimate (tCO₂e/t) | EU default before mark-up (tCO₂e/t) | Charge at default (€/t) | Charge at tool estimate (€/t) | Charge at default (€ million) | Charge with verified data (€ million) |
|---|---|---|---|---|---|---|---|
| Hot-rolled flat steel (7208) | 169 | 0.66 | 4.05* | 421 | 53 | 71 | 9 |
| Long steel (7213, 7214, 7216) | 294 | 0.28 | 4.00* | 416 | 22 | 122 | 7 |
| Cement clinker (2523 10) | 1,350 | 0.87 | 1.27 | 132 | 70 | 178 | 94 |
| Anhydrous ammonia (2814 10) | 147 | 1.89 | 2.05 | 166 | 151 | 24 | 22 |
| Urea (3102 10) | 3,286 | 1.22 | 1.39 | 112 | 98 | 369 | 321 |
| Ammonium nitrate (3102 30) | 9 | 1.93 | 2.39 | 193 | 154 | 2 | 1 |
| Unwrought aluminum (7601) | 135 | 2.51 | 1.87 | 194 | 200 | 26 | 26† |
| Total | 5,390 | 793 | 480 |
Egypt’s steel is the clearest case for verification: with no country default, the EU charges it as if it came from the most intensive exporters. The Commission’s workbook lists no Egyptian default for carbon steel, so hot-rolled flat steel and long products fall to the “other countries” values of 4.05 and 4.00 tCO₂ per tonne before mark-up, close to those of blast-furnace steel (European Commission 2026b). The tool puts Egypt’s gas-based steel at 0.73 and its scrap-based steel at 0.16 tCO₂ per tonne. Declared at the default, Egyptian hot-rolled steel would owe €421 per tonne at full phase-in, more than the €252 charged on Turkish blast-furnace steel in Table 3; declared at the tool’s estimate it would owe €53. On the two steel rows, verified data would cut the charge from €193 million to €16 million a year at 2025 volumes. The year matters: EU imports of Egyptian hot-rolled steel fell from 696,000 tonnes in 2024 to 169,000 in 2025, and at 2024 volumes the steel charge would fall from €476 million to €47 million.
The steel estimate is also the least certain number in the application, and the conclusion survives the uncertainty. The gas-based factor fell from 1.63 to 0.73 tCO₂ per tonne between versions 1.1 and 1.2 of the workbook, when natural gas use per tonne was set to a figure reported for one plant (CBAM Policy Tool 2026). The EU’s own numbers bracket it. Its default benchmark for hot-rolled steel made through direct reduction is 0.481 tCO₂ per tonne (European Commission 2025d, Annex point 5.3), and its default value for Iran, a large producer of gas-based steel, is 1.94 (European Commission 2026b). The tool’s factor is also per tonne of crude steel, while CBAM charges per tonne of the rolled product, which adds the reheating furnace and rolling losses. At 1.63 or 1.94 for the gas-based route, the charge on Egyptian steel with verified data would be €31–36 million a year at 2025 volumes instead of €16 million, still a sixth or less of the €193 million at the default (Table 6). Verification pays for Egyptian steel whichever number is right; only plant data can settle by how much.
Routing can make verified steel look cleaner than Egypt’s steel is. Egyptian steelmakers run both routes, and under plant-level measurement a firm can send scrap-based steel, at 0.16 tCO₂ per tonne, to the EU and the gas-based steel elsewhere. The verified intensity of exports then falls below the country’s production average without any cut in emissions. Paper 1.4 shows that measuring embodied carbon by exporting country and sector removes the gain from such routing, and that a country-level price signal then gives every plant the incentive that plant-level measurement was meant to provide (Stretton 2026c, 2026d). The export-weighted estimate in Table 4 is the right measure of Egypt’s position; a firm’s verified figure may be lower for reasons that do nothing for the climate.
For cement the gap is large, for fertilizers small, and for aluminum the default is a subsidy. Clinker, at 0.87 tCO₂e per tonne against a default of 1.27, would save €62 per tonne, or €84 million a year on 1.35 million tonnes. Urea is Egypt’s largest CBAM export to the EU, 3.3 million tonnes in 2025. Counted as the EU rules require, with its ammonia integrated and the CO₂ it carries counted as emitted, it comes to 1.22 tCO₂e per tonne against a default of 1.39, a saving of only €15 per tonne; the uncorrected tool figure of 0.49 would have suggested €73. Ammonium nitrate, at 1.93 against 2.39, depends on whether the nitric acid plants abate nitrous oxide, which the application could not confirm; the tool reports a range of 0.21–1.91 tCO₂e per tonne for that component alone. Primary aluminum is the one product where the tool’s estimate, 2.51 tCO₂ per tonne, is above the default of 1.87, because of perfluorocarbons from older smelting lines; a producer near the estimate gains nothing from filing data even at the full 30 percent mark-up, and keeps the default.
The Egypt application points to different levers for different products. Across the seven products, declaring verified emissions where they pay would cut the full-phase-in charge from about €793 million to €480 million a year at 2025 volumes, a saving of €313 million: €178 million on steel, €84 million on clinker and €48 million on urea. The remaining €480 million is what a domestic carbon price could then capture at home under Article 9: at the capture price of equation 3, the whole of it, for producers declaring actual data. Two-thirds of that remainder, €321 million, is on urea. For steel and clinker the order is verification first: a domestic price levied before plants file data would be deducted only through a Commission default carbon price, if one is published, while the default values would keep the charge high. For urea, data change little, and the choice is between abatement and a domestic price that keeps the charge at home. A €20 price on urea alone would move about €80 million a year.
9 Policy uses
The tool tells a ministry which lever to pull first, product by product. Where the bottom-up intensity is well below the marked-up default, as for Egyptian steel and clinker, the cheapest lever is verification capacity: accredited verifiers and monitoring at the plants that export to the EU. Where it is near the default, as for Egyptian urea and ammonia, data are worth little, and the choice is between abatement and a domestic price that captures the charge. Where it is above the default, as for Egyptian aluminum, data will not help at all.
It puts a number on the fiscal case for a domestic carbon price on CBAM goods. equation 3 and equation 4 show how much revenue a domestic price would move from the EU budget to the exporter’s, and how much of the fall in the border charge comes from that deduction rather than from abatement. Because a broad price also raises revenue on domestic sales and non-EU exports, the CBAM deduction is often the trigger for a domestic price rather than its main revenue source. Paper 1.1 sets out the architecture in which such a producer price sits alongside a destination-based price on consumption (Stretton 2026g, 2026h).
It shows the cost of designing a domestic price to return its revenue to producers. An output-based rebate or feebate keeps the incentive to cut emissions per tonne and protects output, but under the draft rules it forfeits the deduction, so the border charge falls only by the abatement term of equation 4. The tool makes that trade-off explicit. Paper 1.4 argues that the EU should credit the price signal, not only the payment, and measure embodied carbon by country and sector (Stretton 2026c, 2026d); paper 6.1’s Total Effective Carbon Price offers a way to measure that signal across instruments (Stretton 2026f).
It supports dialogue with the EU on default values and deductions. A country with no default of its own, like Egypt for steel, or whose bottom-up intensities are well below its defaults, has a documented case to put in the revision of default values due in 2027 at the latest (European Commission 2025e, Art. 2). A country with a carbon price can show the Commission what a default carbon price for it should be (European Parliament and Council of the European Union 2025, Art. 9(4)), and can comment on the methodology the Commission is preparing (Technopolis Group 2026).
10 Objections and limits
The strongest objection is that a technology average is not verified plant data. A verified declaration follows the installation’s own monitoring plan, boundaries and precursors under the EU rules (European Commission 2025b, 2025a), and a bottom-up estimate built from engineering ratios can miss in either direction, as the revision of Egypt’s steel factor shows. The answer is to read the estimate as what a plant at the technology average would declare, with the default’s 30 percent mark-up as the margin for error before verification stops paying, and to report ranges. The conclusions that survive the ranges, such as verification for Egyptian steel, hold; the sizes do not, and the first use of the tool is to choose the plants at which to pilot verification.
The tool computes exposure, not incidence. Export volumes are fixed inputs or grow with GDP; there is no trade model, so the tool does not say who bears the charge, how EU buyers switch suppliers or how trade diverts to other markets. Trade-model studies answer those questions at lower product detail (Beaufils et al. 2023; Magacho et al. 2024).
The rules are still moving. The conversion of a carbon price paid into fewer certificates, the evidence required and the treatment of rebates are set by an implementing act that was in the Commission’s adoption workflow, not adopted, on 31 October 2026 (European Commission 2026c). Default values were corrected in July 2026 and are due for revision in 2027 (European Commission 2026a, 2025e), and the July 2026 proposal would slow the phase-out of free allocation and end it in 2038 (European Commission 2026d); if adopted, it would lower every 2028–2037 charge in the example. The cross-sectoral correction factor is set to 1. The tool is not a compliance calculator and should not be used to compute a firm’s certificate obligation.
Coverage is partial. Hydrogen, electricity and the downstream goods proposed in December 2025 are not modeled, and indirect emissions are excluded for steel and aluminum by rule even where electricity is the largest source, as in aluminum smelting (European Parliament and Council of the European Union 2023b, Annex II).
11 Conclusion
The CBAM Policy Tool turns the EU’s border rules into a product-by-product, year-by-year exposure for one exporter, and shows how much verified data, abatement and a domestic carbon price would change it. For steel well above the EU benchmark, most of the charge arrives in 2026, the mark-up alone is worth about €58 per tonne, and a modest domestic price deducted under Article 9 lowers the charge one for one and keeps the money at home. The Egypt application shows that the right lever differs by product: verified data for steel, where a missing country default inflates the charge more than tenfold, and abatement or a domestic price for urea, where the default is close to what plants emit. It also shows that the tool’s accounting must follow the EU’s rules exactly; two fertilizer corrections changed the largest line in the table. The next steps are to carry these corrections into the tool, add the conversion rule once the Commission adopts it, and run the tool with plant-level data for the exporters most exposed.
Downloads
References
Appendix A: Corrections to the tool’s Egypt results
Three changes separate Table 4 from the tool’s Egypt workbook as published (version 1.2). Table 5 lists them. The first two bring the tool’s fertilizer accounting into line with the EU rules; the third replaces the tool’s estimates of EU export volumes, built from production and export shares, with the trade Eurostat records. Together they raise the charge at default values from €595 million to €793 million and the charge with verified data from €177 million to €480 million, and they cut the saving on urea from €117 million to €48 million.
2.Source/egypt_example.py.
| Item | Tool workbook v1.2 | This paper | Reason |
|---|---|---|---|
| Urea, CO₂ bound in the product | Deducted (−0.733 tCO₂/t); estimate 0.49 | Counted as emitted; estimate 1.22 | CO₂ counts as not emitted only if “permanently chemically bound” (European Commission 2025b, Annex II point B.8.2); urea releases it in soil (De Klein et al. 2006) |
| Ammonium nitrate, ammonia content | 0.213 t NH₃ per t (17/80); estimate 1.53 | 0.425 t NH₃ per t (34/80); estimate 1.93 | Both nitrogen atoms come from ammonia, one through nitric acid, a CBAM precursor |
| EU export volumes | Tool estimates for 2024 (urea 1,600 kt; hot-rolled steel 364 kt; clinker 560 kt; ammonia 110 kt) | Eurostat EU imports from Egypt, 2025 (3,286; 169; 1,350; 147 kt); 2024 as a check (2,557; 696; 1,041; 320 kt) | Recorded trade, the same source as the Türkiye example |
| Aluminum total | Charged at the tool estimate (above the default) | Charged at the default | A producer above the default keeps it |
The steel result is shown at three values for the gas-based route. Table 6 gives the charge on Egyptian steel with verified data at the tool’s current factor, at its earlier factor and at Iran’s EU default, against the charge at the default value.
2.Source/table_egypt_sensitivity.csv.
| Gas-based route factor (tCO₂/t) | Hot-rolled flat steel estimate | Long steel estimate | Steel charge with verified data, 2025 volumes (€ million) | Same, 2024 volumes (€ million) |
|---|---|---|---|---|
| 0.73 (tool workbook v1.2) | 0.66 | 0.28 | 16 | 47 |
| 1.63 (tool workbook v1.1) | 1.45 | 0.47 | 31 | 97 |
| 1.94 (EU default for Iran, CN 7208) | 1.72 | 0.54 | 36 | 115 |
| Charge at the EU default value | 5.26 (with mark-up) | 5.19 (with mark-up) | 193 | 476 |
Corrections for the tool itself. The tool’s merchant-DRI factor (1.38 tCO₂ per tonne of DRI) is inconsistent with its gas-based steel factor (0.73 per tonne of steel made mostly from DRI), and its steel factors are per tonne of crude steel rather than of rolled product. Both should be reconciled, and the two fertilizer corrections carried into the workbook, in its next version.
Footnotes
The CBAM Policy Tool is one of the Climate Fiscal AI Tools. The Türkiye example uses public EU and Eurostat data only. The Egypt application in Section 8 reports illustrative results from the tool, corrected as described in Appendix A, with public trade data; they are not official estimates of Egypt’s emissions or of any government’s or institution’s position. Errors are the author’s own.↩︎