Codify Sustainability-Linked Sovereign Lending, Then Give It Scale
Standard indicators, verification and pricing, and why the reward must be bigger than an interest margin
Sustainability-linked loans and bonds tie a government’s interest rate to measured climate outcomes, so they pay for national results rather than projects. They remain rare, bespoke and small: Uruguay’s 2023 World Bank loan, the first sovereign sustainability-linked loan, can save the country at most $12.5 million. I propose codifying the instrument: standard indicators measured as outturns, baselines set by rule, verification from published data and a published price per unit of outperformance. I show that a market bond whose coupon moves with results gives the government the incentive but not the money: investors price the expected step into the issue yield, so the government finances its own reward and pays a premium for the volatility. Such a bond can buy credibility but cannot pay for a reform whose benefits accrue abroad; a fixed coupon with a reward paid by a third party can. An interest rebate is bounded by the interest bill, so rewards at current step sizes are an order of magnitude smaller than the cost of major reforms. Making guarantee capacity the reward multiplies the incentive per dollar of funder cost by about 80 if the guarantor’s claims keep development banks’ preferred-creditor record, the base case shared across this series, and by 2.7 on market-like losses.
sustainability-linked loans, sustainability-linked bonds, sovereign debt, climate incentives, guarantees, results-based finance
Working paper, version 0.2, October 2026. Stephen J. Stretton, writing in a personal capacity. The views expressed are the author’s own and do not represent those of any institution with which he is or has been affiliated. A short version for policy makers is Climate Fiscal Policy Brief No. 4.3.1
1 Executive summary
Policy brief (short version) → · Download this paper (pdf) · Slides (pdf)
Cutting emissions costs a government money now, while most of the benefit goes to other countries later, so the incentive to act has to come partly from outside. Sustainability-linked debt is one of the few instruments that pays a government for national results rather than for projects. Its interest rate depends on measured outturns such as emissions per unit of output. Uruguay’s $350 million World Bank loan, approved in November 2023, is the first sovereign sustainability-linked loan. Its rate falls by 50 basis points a year in 2028–2032 if the methane intensity of beef cattle is at least 33 percent below its 1990 level, one point beyond Uruguay’s first Paris pledge, and by 100 basis points in 2033–2037 at 36 percent. Chile, Uruguay, Thailand and Slovenia have issued sovereign sustainability-linked bonds since 2022.
These instruments are bespoke and small. Each deal invents its own indicators, baselines and step size. The most Uruguay’s loan can save is $12.5 million, 3.6 percent of the principal and about $8 million in present value. Real reforms cost hundreds of millions: South Africa’s transition plan identifies $98 billion of financing needs over five years.
The first step is to codify the instrument. A codified loan is written once and used many times: a menu of indicators that national statistics already report; baselines set at the country’s own Paris pledge plus a published margin; verification of the national inventory by a named verifier; and a published price per unit of outperformance, stated per tonne of CO₂. The World Bank Group’s own reform roadmap already calls for “standardized approaches” to interest buy-downs.
The second step is to separate the investor’s return from the government’s incentive. When a bond’s coupon moves with results, investors who can see the target price the expected step into the issue yield. The government still gains from meeting the target once the bond is sold, so the bond is a commitment device, but the government pays for its own reward and adds a premium for the volatility. It cannot pay for a reform that costs the country more than it gains. A fixed-coupon loan whose reward is paid by a third party, as in the SLIDI design, delivers the same incentive with money from outside, and an intermediary lending to many countries bears the risk more cheaply than bondholders.
Even codified, an interest margin is too small. A rebate cannot exceed the interest bill. A step-down of 100 basis points on a $1 billion loan for ten years is worth $77 million in present value, less than $1 per tonne for a stylized reform that retires 2 gigawatts of coal ten years early and costs $772 million. Matching that cost at 100 basis points needs a $10 billion loan, nearly thirty times Uruguay’s.
The third step gives it scale: make guarantee capacity the reward. A guarantee is worth the whole spread it saves the borrower but costs the guarantor only its expected loss and the cost of holding a buffer. In the stylized reform, $3.3 billion of guarantee capacity saving 300 basis points is worth $772 million to the government. If the guarantor’s claims keep development banks’ preferred-creditor record (0.77 percent of sovereign loans in default a year, 95 percent recovered), its expected cost is about $10 million, with a $16 million buffer held rather than spent: about 80 dollars of incentive per dollar of cost. If its losses are like a market creditor’s (3 percent of exposure called a year, 37 percent lost), the cost is $286 million with a $310 million buffer: 2.7 dollars per dollar, still better than cash. At a 200 basis point saving the multiples are 53 and 1.8.
What to do. Development banks should publish a codified sovereign sustainability-linked loan with an indicator menu, baselines, verification rules and a price per tonne. Advanced economies should back an intermediary that lends on a fixed coupon and refunds interest for verified results, rather than encourage more market bonds with moving coupons. Donors should make guarantee capacity, under the notional capitalized value of paper 4.1 or the Climate Investment Trust of paper 4.2, the main prize, and fund the buffer behind it.
2 Introduction
Climate mitigation pays off globally while its costs fall on national governments, so the incentive for a government to adopt a costly climate policy must come partly from outside. Sustainability-linked debt is one of the few instruments that pays a government for national results rather than for individual projects. Its interest rate depends on key performance indicators (KPIs): measured outturns such as the emissions intensity of output or the area of native forest. In November 2023 the World Bank approved a $350 million development policy loan to Uruguay whose interest rate falls by 50 basis points a year if the methane intensity of beef cattle falls 33 percent below its 1990 reference, and by 100 basis points a year at 36 percent, in each case one percentage point beyond Uruguay’s own Paris pledge (Ministry of Economy and Finance, Uruguay 2023; World Bank 2023b). The most Uruguay can save is $12.5 million, paid over ten years. Chile, Uruguay, Thailand and Slovenia have issued sovereign sustainability-linked bonds since 2022, with coupon steps of 2.5 to 50 basis points per target (Cleary Gottlieb 2022a; Oriental Republic of Uruguay 2023; IFR 2024; Republic of Slovenia 2025).
These instruments are rare, bespoke and small. Each deal invents its own indicators, baselines and step size. The corporate market, which accounts for almost all of the $227 billion of sustainability-linked bonds issued by early 2023 (Stewart and Ul Haq 2023), sets easy targets: issuers miss them only 14–39 percent of the time on average (Feldhütter et al. 2024). And the rewards are tiny relative to what climate policy costs. South Africa’s Just Energy Transition Investment Plan identifies $98 billion of financing needs over five years (UK Government 2022); Uruguay’s reward is worth about $8 million in present value.
This paper asks whether sustainability-linked sovereign lending can become a scalable incentive instrument, and how large its reward must be to change policy.
The answer has three parts. First, codify it: a menu of standard indicators measured as outturns, baselines set by rule from the country’s own Paris pledge, verification from published national data, and a pricing schedule that sets the reward per unit of outperformance in carbon-price-equivalent terms. Second, separate the investor’s return from the government’s incentive: investors hold a fixed coupon and a trusted intermediary pays the reward, the SLIDI design of Estevão et al. (2024). Third, recognize that an interest margin is too small to matter for large reforms, and make guarantee capacity under the notional capitalized value (Stretton 2026e) or collateral in the Climate Investment Trust (Stretton 2026g) the prize for meeting the indicators.
The paper makes four contributions, each against named prior work.
- Who pays the reward (Section 5.3). Lefournier (2023) shows that a sustainability-linked bond is priced at the issuer’s ordinary yield, so its terms cannot lower the issuer’s cost of capital, and Feldhütter et al. (2024) find that bond prices reflect the size of the penalty with no mispricing. I state the consequence for sovereigns as a proposition: a market bond gives the government the same ex post incentive as a third-party reward but no money, because the government finances its own reward and pays a premium for its volatility. A government will therefore issue a market bond that binds it to a costly reform only if the label premium covers the cost, which explains why targets are easy. The SLIDI paper proposed the third-party design informally; Proposition 2 gives the condition under which it is cheaper.
- The interest bound (Section 5.4). A reward paid as an interest rebate cannot exceed the present value of the interest bill, so to induce a reform with net cost \(K\) the loan must exceed \(K/[(q_1-q_0)\,i\,A_T]\) (Proposition 3). For a stylized $772 million coal reform, a step-down of 100 basis points needs a $10 billion loan; even a loan whose whole interest bill is waived must exceed $1.7 billion. The results-based aid literature (Birdsall and Savedoff 2010; Svensson 2003) asks how to pay for outcomes; this bound says how much a debt instrument can pay.
- Guarantee capacity as the reward (Section 5.5). Delivering the reward as guarantee capacity multiplies the incentive per dollar of funder cost by the ratio of the spread saved to the guarantor’s expected loss plus buffer cost (Proposition 4): about 80 in the series’ base case, which assumes the guarantor’s claims keep development banks’ preferred-creditor loss record and is shared with the companion papers on the notional capitalized value and the Climate Investment Trust (Stretton 2026e, 2026g); 10 in a middle case; and 2.7 in a stress case with market-like losses.
- A codified instrument (Section 4). A concrete indicator menu (Appendix A), drawn from instruments already in use, with baseline, verification and pricing rules. It builds on the World Bank’s framework for sovereign KPIs (Flugge et al. 2021) and answers the World Bank Group’s call for “standardized approaches” to interest buy-downs (World Bank Group 2022).
3 Market evidence and literature
3.1 Sovereign sustainability-linked debt, 2022–2026
Five sovereign instruments show the range of designs, and they share a structure: unrestricted borrowing whose price depends on national outturns (Table 1). They differ in who pays the reward and how large it can be.
2.Source/model.py). Sources: Cleary Gottlieb (2022a); Ministry of Finance, Chile (2023); Cleary Gottlieb (2022b); Oriental Republic of Uruguay (2023); Ministry of Economy and Finance, Uruguay (2023); World Bank (2023a); IFR (2024); Asian Development Bank (2024); Republic of Slovenia (2025).
| Chile bond | Uruguay bond | Uruguay World Bank loan | Thailand bond | Slovenia bond | |
|---|---|---|---|---|---|
| Date | March 2022 | October 2022 | Approved November 2023 | November 2024 | June 2025 |
| Size and term | $2bn, 4.34%, due 2042 | $1.5bn, 5.75%, due 2034; $2.2bn after 2023 reopening | $350m, 15.5 years | Bt30bn ($874m), 2.70%, 15.5 years | €1bn, 3.125%, due 2035 |
| KPIs | GHG emissions 95 MtCO₂e by 2030; 60% of power from non-conventional renewables by 2032 | GHG intensity of output vs 1990; native forest area vs 2012 | Methane intensity of beef cattle vs 1990 | GHG 30% below business as usual by 2030; 440,000 zero-emission vehicle registrations a year by 2030 | Total GHG emissions vs 2005 (35% and 45% cuts by 2030) |
| Step | +12.5 bp per missed target, from 2034 | +15 bp per lower target missed, −15 bp per higher target met, from 2027 | −50 bp a year (2028–32), −100 bp (2033–37); no step-up | ±2.5 bp | +50 bp if lower target missed, −50 bp if higher met, from 2034 |
| Maximum reward to the government | None (step-up only) | 30 bp a year: about $40m in total | $12.5m in total | Small | 50 bp a year |
| Who pays the reward | — | Bondholders | IBRD Global Public Goods Fund | Bondholders | Bondholders |
The market is growing slowly at the sovereign level. Thailand reopened its first bond until it had raised more than Bt230 billion, and in September 2026 sold a second, Bt25 billion bond that adds a target for protected areas (Standard Chartered 2026). Slovenia’s issue, the first by a European sovereign, uses the largest step so far, 50 basis points each way (Republic of Slovenia 2025). Kenya has announced a $1 billion program whose first tranche, from September 2026, is reported to be a syndicated sustainability-linked loan with a World Bank credit enhancement, KPIs on forest loss and rural electricity access, and an expected saving of about 200 basis points against a conventional Kenyan issue (Muiruri 2026). If it closes on those terms it will be the first sovereign instrument to combine a guarantee with a performance link, the combination this paper proposes; its terms had not been confirmed in a World Bank document at the time of writing.
Uruguay’s loan is the cleanest public example of a sovereign sustainability-linked loan, and its terms are published in detail by the Ministry of Economy and Finance (Ministry of Economy and Finance, Uruguay 2023). The KPI is methane from enteric fermentation and manure of non-dairy beef cattle per unit of live weight, computed with the 2006 IPCC Guidelines as in Uruguay’s national inventory, on a truncated five-year rolling average. The reference is the truncated average for 1987–1991. The latest official value at approval was a 28 percent reduction, for 2018. The lower target, 33 percent, is one point beyond the unconditional 32 percent in Uruguay’s first Nationally Determined Contribution; the higher target, 36 percent, is one point beyond the 35 percent in its second. The United Nations Development Programme verifies the figures each year. The reward is capped at $6.7 million for performance years 2028–2032 and $5.8 million for 2033–2037, with one “buffer year” in 2038 that can recover a single missed year, and interest can never become negative. The standard alternative was the World Bank’s floating rate, SOFR plus a variable spread of 109 basis points, so the 100 basis point step nearly removes the Bank’s margin. The reward is paid from the World Bank’s Fund for Innovative Global Public Goods Solutions (World Bank 2023a), and the ministry presents the loan as a response to the World Bank Group’s Evolution Roadmap, which called for “long-term performance-based incentive mechanisms, including interest buydowns” (Ministry of Economy and Finance, Uruguay 2023).
Two features of the loan matter for what follows. It is step-down only: missing the target returns the loan to standard terms rather than raising the rate. And a third party funds the reward: a dedicated fund at the World Bank, not the lender’s other borrowers or bondholders. Both are steps toward the design proposed here. The Uruguay bond is the contrast. Its maximum step-down is worth more, about $40 million on $2.2 billion, but bondholders pay it only after charging for it at issue (Section 5.3).
3.2 The corporate market and the pricing evidence
The sustainability-linked bond market grew fast and then stalled. Cumulative issuance reached $226.6 billion by the end of the first quarter of 2023, and new issuance in that quarter was 17 percent below a year earlier (Stewart and Ul Haq 2023). The market’s voluntary standards are the International Capital Market Association’s Sustainability-Linked Bond Principles, last updated in June 2024 (International Capital Market Association 2024), and, for loans, the Sustainability-Linked Loan Principles of the three loan market associations, last updated in March 2025 (Loan Market Association et al. 2025). Both ask the borrower to select material KPIs, calibrate ambitious targets, link them to the instrument’s terms, report and have performance verified; the loan principles make post-signing external verification of every target mandatory. Neither says which KPIs, which targets or what step size.
The step size has no economic basis. Coupon step-ups appear in 58 percent of sustainability-linked bonds issued to November 2023, at an average of 24.8 basis points per target, and the Climate Bonds Initiative judges the sustainability credentials of many to be weak (Climate Bonds Initiative 2024). World Bank staff call 25 basis points “the arbitrary market norm” and note that late target dates and call options let issuers avoid penalties (Stewart and Ul Haq 2023).
The pricing studies agree that targets are easy and that investors pay little for the label, and they disagree about whether the step is priced. Feldhütter et al. (2024) compare each sustainability-linked bond with a synthetic ordinary bond of the same issuer on the same day. They find a label premium of 1–2 basis points, an average probability of missing the target of 14–39 percent, and prices that “depend strongly on the size of the potential penalty”, with no evidence of mispricing. Kölbel and Lambillon (2023), comparing yields at issue, find a premium of about 9 basis points that does not vary with the size of the step-up, is larger for an issuer’s first bond, and on average exceeds the penalty the issuer would pay for missing its target. Berrada et al. (2022) model the incentives and pricing of these bonds and conclude that the industry overstates the yield discount. The green bond literature finds a similar small label premium, about 2 basis points (Zerbib 2019). Lefournier (2023) explains why: a sustainability-linked bond and an ordinary bond of the same issuer are priced at the same issuer yield, so no choice of step size, step period or target can lower the issuer’s cost of capital materially.
3.3 Paying governments for results
Sustainability-linked lending is a form of results-based finance, and that literature names its two hard problems. Svensson (2003) argues that conditional aid fails because donors cannot commit to withhold it once a government misses its conditions, and proposes committing aid to a group of countries and allocating it afterwards by performance. Birdsall and Savedoff (2010) propose “cash on delivery”: a fixed payment per unit of an independently verified outcome, paid after the fact, with the government free to choose how to achieve it. A codified sustainability-linked loan applies both ideas to climate: the reward is set in advance per unit of a verified outturn, and a portfolio of countries lets a funder commit to rewards it will actually pay.
The World Bank has started down this path. Its Evolution Roadmap observes that governments have little incentive to invest in global public goods whose benefits come decades later, and proposes “standardized approaches to providing concessionality through mechanisms like interest buy-downs and performance-based incentives” (World Bank Group 2022). Its Framework for Financial Incentives, approved in April 2024, offers more financing and price incentives for projects with cross-border benefits (World Bank 2025). That framework rewards projects, as inputs, when they are approved; Uruguay’s loan rewards a national outturn after it is verified. This paper is about the second.
3.4 Sovereign design proposals
The sovereign literature argues that the instrument suits governments because a government’s KPIs can be national. Giráldez and Fontana (2022) make the case for sovereign sustainability-linked bonds. The World Bank’s framework for sovereign KPIs sets out how to choose indicators that investors find ambitious and issuers find achievable (Flugge et al. 2021). The OECD identifies six constraints on scaling the market in developing countries and the roles donors can play (OECD 2024). Stewart and Ul Haq (2023) propose a matrix for judging whether targets are feasible and ambitious, and argue that step-downs suit sovereigns better than step-ups.
The closest design to this paper is SLIDIs (Estevão et al. 2024). It starts from the observation that variable coupons deter investors and proposes two models. In the first, a government issues a fixed-coupon bond tied to KPIs, and a development bank or donor trust fund pays the government a reward if the KPIs are met. In the second, recommended, model, a trusted intermediary backed by a coalition of advanced economies issues fixed-coupon bonds at a low rate, on-lends at a higher fixed rate as sustainability-linked loans, and refunds part of the interest when the KPIs are met. Development agencies monitor the KPIs and give technical help.
3.5 Other routes to a sovereign incentive
Sustainability-linked lending is one of several ways the international system can reward national climate policy, and the series this paper belongs to compares them. Policy crediting pays per tonne cut by a policy, with the cut measured as a carbon-price equivalent, the uniform carbon price that would cut emissions by as much (Stretton 2026c, 2026b). Conditional de-risking offers guarantees and payment intermediaries for a country’s clean power pipeline in return for reform (Stretton 2026a). The notional capitalized value credits a country with a climate balance that sets its guarantee capacity (Stretton 2026d), and the Climate Investment Trust holds the capital behind those guarantees and national beneficiary accounts (Stretton 2026f). Climate clubs reward members with trade terms rather than money (Nordhaus 2015).
3.6 The gap
The literature describes the instrument and its pricing and leaves three gaps. It has not said what a standard sovereign instrument should contain so that it can be repeated cheaply. It has shown that a market sustainability-linked bond cannot lower an issuer’s cost of capital, but not what follows for a government that needs money from outside to pay for a reform. And it has not compared the size of the reward with the cost of the policies it is meant to induce. This paper fills all three and proposes a route to scale.
4 Codifying the instrument
A codified instrument is a contract written once and used many times: an indicator menu, a baseline rule, a verification rule, a timing rule and a pricing schedule. Each borrowing then specifies only which indicators apply and how much debt is linked.
4.1 Indicators measured as outturns
Indicators should measure physical or fiscal outturns that national statistics already report, not process steps. “Methane per kilogram of beef” is an outturn; “methane strategy adopted” is a process step. Outturns have three advantages. They are hard to satisfy on paper. They leave the government free to choose the cheapest policy, so the lender does not substitute its judgment for the government’s. And they connect to tonnes, which lets the reward be priced (Section 4.5). Process indicators have one advantage, speed: a law can be passed this year, while an emissions outturn appears years later. Section 4.4 deals with that trade-off.
Appendix A gives a menu of eleven outturn indicators in six sectors, each with a published source and, where one exists, an example in use. The economy-wide indicators, greenhouse gas emissions and emissions per unit of output, are in the Chilean, Uruguayan, Thai and Slovenian bonds. Sector indicators (power emissions intensity, the non-fossil share of generation, methane intensity of livestock, native forest area, the zero-emission share of new vehicles) are in the Chilean, Uruguayan and Thai instruments. Two fiscal indicators measure the policy itself: the Total Effective Carbon Price (Stretton 2026b) and the gap between domestic and reference fuel prices. A utility cost-recovery ratio, the share of a power utility’s costs its tariffs cover, measures the precondition for guaranteeing clean power contracts (Stretton 2026a).
One indicator class deserves a premium: legally durable commitments. “A carbon tax legislated for this year is a gesture. A carbon tax with a statutory floor trajectory and contractual counterparties is a commitment” (Stretton 2026h). A codified menu can reward durability by paying for indicators that stay above target for several consecutive years, as Uruguay’s loan does by paying in each of ten years rather than once.
4.2 Baselines set by rule
The baseline decides whether a target is ambitious, and an issuer negotiating its own baseline will choose a soft one. Uruguay’s loan shows the rule worth copying: the target is the country’s own unconditional Paris pledge plus a fixed margin of outperformance, one percentage point (Ministry of Economy and Finance, Uruguay 2023). That rule anchors the target to a commitment the government has already made in public, and the margin makes the reward pay only for doing more. Slovenia’s bond uses the same idea with two targets, a step-up for missing the lower and a step-down for beating the higher (Republic of Slovenia 2025). A codified menu should fix the margin by indicator and publish it.
Anchoring to the pledge has a cost: countries with weak pledges face weak targets. Two corrections are possible. The menu can set a floor on the target from peer performance, for example the median rate of improvement among countries at similar income. Or the pricing schedule can pay less per unit for outperforming a weak pledge. The first is simpler.
4.3 Verification from published data
Verification should check data the country already publishes, not commission new surveys. Uruguay’s loan uses the same methodology as its reports under the Paris Agreement, smoothed over five years to remove weather noise and reviewed by the United Nations Development Programme under the UN climate convention’s guide to peer review of national inventories (Ministry of Economy and Finance, Uruguay 2023). The loan market’s principles already make external verification of every target mandatory (Loan Market Association et al. 2025). A codified instrument should name one verifier per indicator class and one methodology, so that verification is a repeated service rather than a bespoke contract.
4.4 Timing
Outturn indicators arrive late, and that lag is the instrument’s main design problem. Uruguay’s methane KPI for observation year 2025 is computed from data for 2022–2026, calculated in 2027 and verified by May 2028; the reward for observation year 2034 is applied in 2037 (Ministry of Economy and Finance, Uruguay 2023). A government that bears the cost of a reform in 2024 sees the first reward four years later and the last thirteen years later. If the government discounts the future at a political rate above the market rate, the incentive shrinks further (Corollary 2).
Three design choices shorten the lag. First, reward early achievement: Uruguay’s loan makes the higher step available a year early (Ministry of Economy and Finance, Uruguay 2023). Second, combine one fast indicator of policy adoption, such as a carbon price legislated on a published path, with slow outturn indicators, so that part of the reward, or access to a further concessional loan, arrives when the policy is adopted. Third, pay the reward in a form the government can use immediately: an increase in guarantee capacity or a credit to a beneficiary account that can be pledged now, rather than a rebate on interest due in a decade (Section 7.2).
4.5 A pricing schedule in carbon-price-equivalent terms
The reward per unit of outperformance should be published, not negotiated. The natural unit is the carbon-price equivalent. For an indicator \(k\), let \(\varepsilon_k\) be the tonnes of CO₂-equivalent a year implied by one unit of outperformance (for example, one percentage point of methane intensity times the sector’s output), and let \(p\) be a notional price per tonne. The schedule pays \[ r_k = p\,\varepsilon_k \tag{1}\] per unit per year, capped. This does three things. It makes rewards comparable across indicators and countries, so a funder can allocate a budget. It puts sustainability-linked lending on the same scale as policy crediting (Stretton 2026c, 2026b) and the notional capitalized value (Stretton 2026d), which both price tonnes. And it reveals how small current rewards are: Section 6.2 shows that a 100 basis point step-down on $1 billion pays less than $1 per tonne for a stylized coal reform.
The schedule need not use one price for every indicator. I propose standard weights for each indicator class, set by how durable and how certain each indicator’s emission effect is, much as bank capital rules use standard risk weights rather than a negotiation for each loan. What matters is that the weights are published before deals are struck.
4.6 Separating the investor from the incentive
The final element decides who pays the reward. In a sustainability-linked bond, bondholders pay a step-down and receive a step-up. In the SLIDI design, bondholders receive a fixed coupon and a third party pays the reward (Estevão et al. 2024). Section 5.3 shows why the second is better for a sovereign that needs outside money. The practical structure is the trusted-intermediary model: an intermediary backed by guarantees from advanced economies issues fixed-coupon bonds at a low rate, on-lends to governments as sustainability-linked loans at a higher fixed rate, and refunds part of the interest already paid when verified KPIs are met. The spread pays the intermediary’s costs. A missed target costs the government its refund; bondholders’ coupon does not change.
5 A model of the reward
The model asks how large a reward must be to change a policy, who should pay it, and how large it can be in each form. Proofs are in Appendix B.
5.1 Setup
A government chooses whether to adopt a climate policy, \(a \in \{0, 1\}\). The policy has net domestic cost \(K > 0\) in present value: its fiscal and political cost less its domestic benefits, including local air quality and lower fuel imports. For a mitigation policy whose benefits are mostly global, \(K\) is positive. A reward of present value \(V\) is paid if a verified KPI meets its target. The target is met with probability \(q_1\) if the policy is adopted and \(q_0 < q_1\) if not; \(q_0\) captures luck, trend and the softness of the target. The government is risk-neutral over the reward and maximizes expected net benefit.
The reward can take three forms. An interest rebate of \(\Delta_t\) per year on debt outstanding \(D_t\) gives \(V = \sum_t \delta^t \Delta_t D_t\), where \(\delta = 1/(1+r)\) is the discount factor. Guarantee capacity \(G\) for \(T\) years on borrowing that would otherwise pay a spread \(s\) above the guaranteed rate gives \(V = u\,s\,G\,A_T\), where \(u \le 1\) is the share of capacity the government uses and \(A_T = \sum_{t=1}^{T}\delta^t\) is the annuity factor. A credit to a pledgeable account is analyzed like guarantee capacity, with collateral in place of the guarantee.
5.2 How large must the reward be?
Proposition 1 (minimum reward). The government adopts the policy if and only if \[ V \ge V^* \equiv \frac{K}{q_1 - q_0}. \tag{2}\] The funder’s expected payout at \(V^*\) is \(q_1 V^* = K\,q_1/(q_1 - q_0)\), which exceeds \(K\) whenever \(q_0 > 0\).
A reward paid whatever the government does buys nothing; only the change in the probability of payment, \(q_1 - q_0\), motivates. Two corollaries follow.
Corollary 1 (soft targets are expensive). The funder’s cost per dollar of policy cost is \(q_1/(q_1 - q_0)\). With \(q_1 = 0.9\), it is 1.0 when the target is unreachable without the policy (\(q_0 = 0\)), 1.5 when \(q_0 = 0.3\), and 3.0 when \(q_0 = 0.6\). Corporate issuers miss their targets only 14–39 percent of the time (Feldhütter et al. 2024). That is a probability under whatever the issuer actually did, so it does not measure \(q_0\), but it shows that targets are set where they are likely to be met. Anchoring targets above the country’s own pledge (Section 4.2) lowers \(q_0\).
Corollary 2 (late rewards must be larger). If the reward is paid \(\tau\) years after the cost and the government discounts at a political rate \(\rho\) above the market rate \(r\), the required reward in market present value rises by the factor \([(1+\rho)/(1+r)]^{\tau}\). With \(r = 5\) percent, \(\rho = 10\) percent and \(\tau = 9\), about the midpoint of Uruguay’s performance period measured from approval, the factor is 1.5.
5.3 Who should pay the reward?
A sustainability-linked bond sold to investors and a fixed-coupon loan with a third-party reward can give the government the same incentive: the same swing \(\Delta\) per year between what it pays if it misses the target and what it pays if it meets it. They differ in who pays. With the target met with probability \(q\), the swing makes the government’s annual payment uncertain, with standard deviation \(\sigma = \Delta\sqrt{q(1-q)}\). Let \(\theta \ge 0\) be the premium per unit of \(\sigma\) that investors require to hold this KPI risk: a premium for complexity, illiquidity and the poor fit of variable coupons with fund mandates (Estevão et al. 2024). Let \(\ell \ge 0\) be the label premium, the yield investors forgo to hold a labeled bond whatever its terms (Kölbel and Lambillon 2023; Feldhütter et al. 2024).
Proposition 2 (third-party rewards pay; market steps commit). Suppose investors are competitive, know \(q_0\) and \(q_1\), and anticipate the government’s choice, so that the bond is priced at the probability \(q = q_a\) that applies to the action taken.
(i) Same incentive. Under either design, once the debt is contracted, adopting the policy saves the government \(\Delta(q_1 - q_0)\) a year in expectation, so the swing needed to induce adoption is the same.
(ii) Under a market bond the government pays for its own reward. The expected step is priced into the issue yield, so the government’s expected net transfer from the KPI terms is \(-\theta\sigma\) a year. The label premium \(\ell\) is the same whatever the government does, so it gives no incentive.
(iii) Under a fixed-coupon loan whose reward \(\Delta\) is paid by a third party that charges \(\theta_I\) per unit of \(\sigma\), the government’s expected net transfer is \(q\Delta\) a year, and the third party’s cost is \(q\Delta + \theta_I\sigma\).
(iv) The difference between (iii) and (ii) for the government, \(q\Delta + \theta\sigma\), is a transfer of \(q\Delta\) from the funder plus a saving of \(\theta\sigma\). The saving to society is \((\theta - \theta_I)\sigma\) a year, positive whenever \(\theta_I < \theta\).
Part (ii) restates for sovereigns what Lefournier (2023) argues for all issuers and what Feldhütter et al. (2024) find in prices: the step is paid for at issue. Part (i) is the part usually missed: the market bond still changes behavior after it is sold. It is a commitment device, financed by the government. That is useful when the government’s problem is credibility, when it wants to adopt the policy but cannot persuade investors or its successors that it will. It is no use when the problem is that the policy costs the country more than it gains, which is the problem of mitigation. Part (iv) separates what the third-party design adds: mostly money from outside, plus a smaller real saving where an intermediary bears KPI risk more cheaply than bondholders. The condition \(\theta_I < \theta\) holds when the intermediary holds KPI risk across many countries whose outturns are imperfectly correlated, and when its mandate is to bear it.
Corollary 3 (why targets are easy). A government issues a market bond that binds it to a policy of net cost \(K\) only if the label premium covers that cost and the risk premium: \(\ell A_T D \ge K + \theta\sigma A_T D\) on debt \(D\). With label premiums of 1–9 basis points, no bond of realistic size passes this test for a costly reform. A government therefore chooses targets it would meet anyway, where \(K\) is close to zero and \(q_0\) close to \(q_1\). That is what the evidence on corporate targets shows, and it means the label rewards issuance rather than results.
A step-up is worse in one further way. The money from a missed target goes to bondholders who did nothing to earn it and does nothing to put the country back on track.
5.4 How large can an interest rebate be?
Proposition 3 (the interest bound). An interest rebate cannot exceed the interest bill: if the loan pays interest at rate \(i\), then \(\Delta_t \le i\) and \[ V \le i \sum_t \delta^t D_t. \tag{3}\]
For a bullet loan \(D\) over \(T\) years, a rebate can induce a policy of net cost \(K\) only if \[ D \ge \frac{K}{(q_1 - q_0)\, i\, A_T}. \tag{4}\]
With a constant step-down \(\Delta < i\), replace \(i\) by \(\Delta\): the required loan rises in proportion to \(i/\Delta\).
The bound says that interest rebates scale with debt, not with ambition. A government that wants a larger reward must borrow more, and the reward can never exceed what the loan’s interest costs. Section 6.2 shows the bound binding for a stylized reform.
5.5 How large can guarantee capacity be?
Proposition 4 (leverage of guarantee capacity). Let a guarantor hold buffer capital \(b\) per unit of exposure, at an annual opportunity cost \(r_b\), and expect an annual probability \(\pi\) that the guarantee is called, with loss \(L\) per call. Guarantee capacity \(G\) used at rate \(u\) gives the government \(V = u\,s\,G\,A_T\) and costs the guarantor \(C_G = (u\,\pi L + b\,r_b)\,G\,A_T\) if the buffer is held against capacity. The incentive per dollar of guarantor cost is \[ \lambda = \frac{u\,s}{u\,\pi L + b\,r_b}, \tag{5}\] and guarantee capacity delivers more incentive per dollar than a rebate or cash, for which \(\lambda = 1\), if and only if \(u\,s > u\,\pi L + b\,r_b\).
The condition holds when spreads are large relative to expected losses. Credit risk accounts for only a small share of yield spreads on investment-grade corporate bonds and a much larger share on high-yield bonds (Huang and Huang 2012); the rest is a risk and liquidity premium that a diversified, long-horizon guarantor need not charge. The condition fails for a government already near the guarantor’s own credit, where \(s\) is small, and for a government in distress, where \(\pi\) is high. It also fails if capacity goes unused, because the buffer is held against capacity whether or not it is drawn.
Corollary 4. With the reward set at \(V^*\), the funder’s cost falls from \(q_1 V^*\) under a rebate to \(q_1 V^*/\lambda\) under guarantee capacity.
6 Two applications
6.1 Uruguay’s loan: a signal, not a payment
Uruguay’s maximum reward can be reproduced from the published amortization schedule, and it is small. The loan repays $15.2 million of principal every six months from April 2028 to April 2039 (Ministry of Economy and Finance, Uruguay 2023). Applying 50 basis points to the average balance in each of 2028–2032 and 100 basis points in 2033–2037 gives $6.8 million and $6.1 million, within $0.4 million of the published caps of $6.7 million and $5.8 million; the difference arises because each year’s step is applied to the next two semi-annual payments, on lower balances. The total cap of $12.5 million is 3.6 percent of the principal. Discounted to 2023 at 5 percent, the maximum reward is worth about $8 million (Table 2).
2.Source/model.py.
| Year | Average balance ($m) | Step-down (bp) | Maximum reward ($m) |
|---|---|---|---|
| 2028 | 335 | 50 | 1.7 |
| 2030 | 274 | 50 | 1.4 |
| 2032 | 213 | 50 | 1.1 |
| 2033 | 183 | 100 | 1.8 |
| 2035 | 122 | 100 | 1.2 |
| 2037 | 61 | 100 | 0.6 |
| Total, 2028–2037 | 12.9 (cap 12.5) | ||
| Present value at 5%, 2023 | 8.4 |
The loan’s design is good and its scale is a signal. The rebate rises to 100 basis points just as the balance halves, so the larger step applies to a smaller loan. The reward is spread across a decade that starts four years after approval. For Uruguay’s beef sector, $12.5 million is not a payment that could change farm economics on its own; the ministry says the savings will be channeled to climate-smart agriculture (Ministry of Economy and Finance, Uruguay 2023). It is what the ministry presents it as: an incentive mechanism for global public goods and a template. Uruguay’s own bond shows the alternative and its limit. Its maximum step-down is worth about $40 million ($27 million in present value at 5 percent), three times the loan’s, but by Proposition 2 the bondholders charged for it when they bought the bond. The question this paper asks is how to turn the template into a payment.
6.2 A stylized coal-to-clean reform
Consider a reform that retires 2 gigawatts (GW) of coal-fired capacity ten years early and replaces it with procured clean power. The numbers are stylized and chosen for round arithmetic. The plants run 6,000 hours a year at 0.95 tCO₂ per megawatt-hour, so retirement avoids 11.4 MtCO₂ a year. The government’s net cost (compensation to plant owners, transition support for coal regions and a higher tariff while the replacement is built, less domestic benefits) is $100 million a year for ten years, $772 million in present value at 5 percent, or about $9 per tonne avoided. Take \(q_1 - q_0 = 1\), the most favorable case for every instrument, so the required reward equals \(K\).
Figure 1 and Table 3 compare the rewards. A step-down of 100 basis points on a $1 billion loan for ten years is worth $77 million, a tenth of the cost and less than $1 per tonne avoided. Matching the cost at that step needs a $10 billion loan. Even waiving all interest at 6 percent on $1 billion for ten years is worth $463 million, short of the cost; by Proposition 3 the loan would have to exceed $1.7 billion and carry no interest at all. Policy crediting at $10 per tonne would be worth $880 million, enough to pay for the reform, at a cost in cash of the same amount (Stretton 2026c).
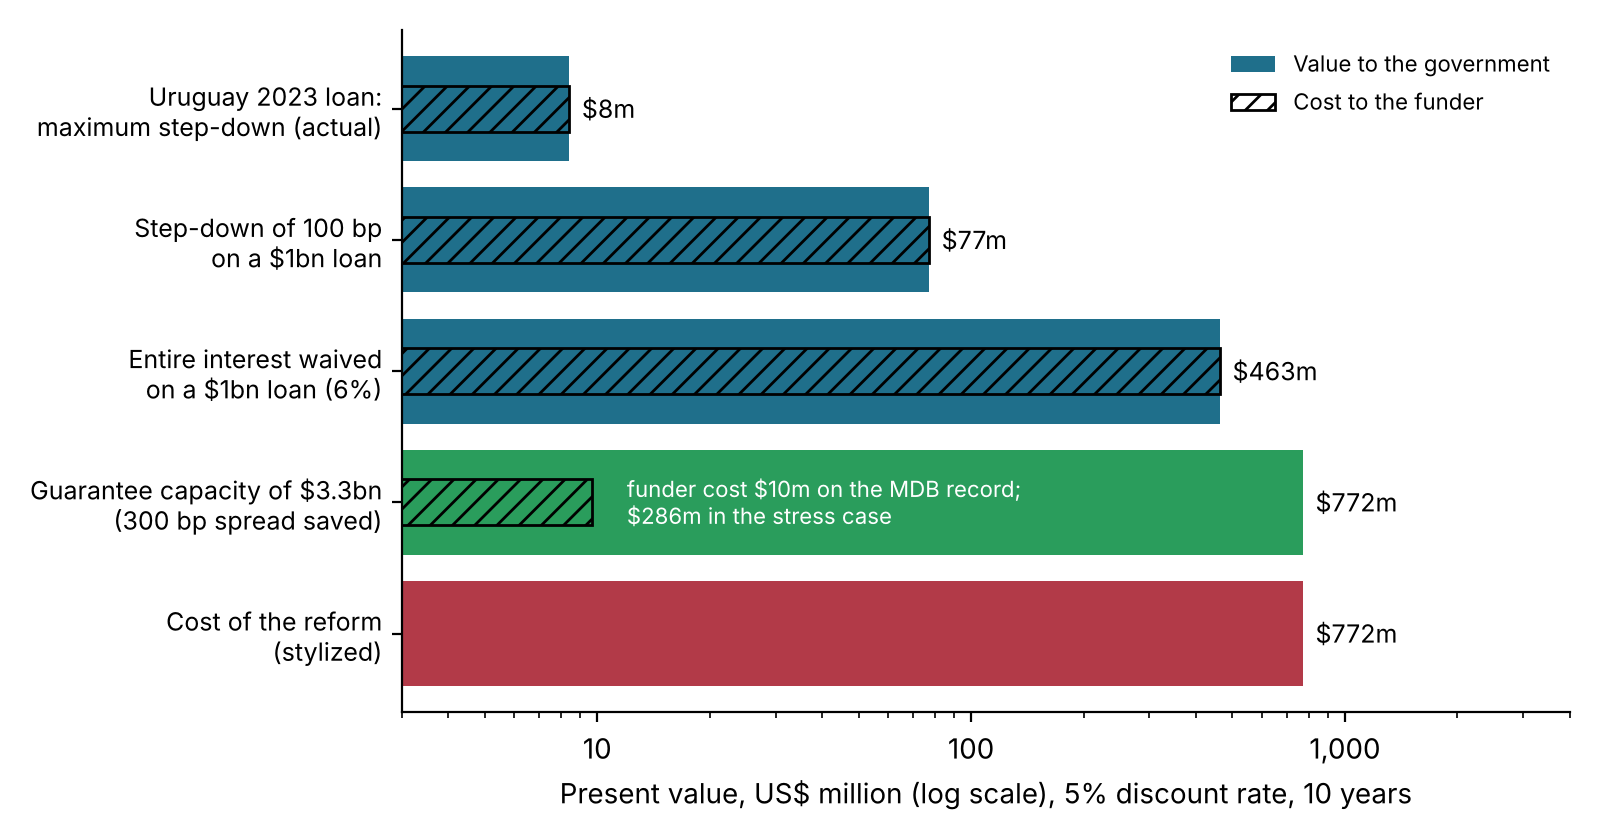
2.Source/model.py.
2.Source/model.py.
| Reward | Value to government ($m PV) | Cost to funder ($m PV) | Incentive per $ of cost |
|---|---|---|---|
| Uruguay loan, maximum step-down (actual) | 8 | 8 | 1.0 |
| Step-down of 100 bp on $1bn for 10 years | 77 | 77 | 1.0 |
| All interest waived on $1bn at 6% for 10 years | 463 | 463 | 1.0 |
| Policy crediting at $10/tCO₂ for 10 years | 880 | 880 | 1.0 |
| Guarantee capacity of $3.3bn, 300 bp saved, 10 years: base (MDB record) | 772 | 10 | 80 |
| Same, middle case (3% calls, 10% loss) | 772 | 77 | 10 |
| Same, stress case (3% calls, 37% loss) | 772 | 286 | 2.7 |
| Stylized reform cost | 772 |
Guarantee capacity reaches the reform’s cost for a small fraction of the funder’s outlay. Capacity of $3.3 billion on borrowing that saves 300 basis points is worth $772 million to the government. If the guarantor’s losses match development banks’ sovereign record, the series’ base case, its expected cost is about $10 million and the buffer behind it is $16 million, which donors hold rather than spend. Each dollar of guarantor cost buys about 80 dollars of incentive. If calls are as frequent as 3 percent a year and lose 10 cents per dollar, the cost is $77 million and the ratio 10; if they lose 37 cents, the average haircut in sovereign restructurings, the cost is $286 million, the buffer $310 million and the ratio 2.7. Even in that stress case the funder pays less than two-fifths of the reform’s cost. Charging the buffer a 2 percent a year carry cost lowers the ratio to 63 in the base case and 2.3 in the stress case.
The leverage depends on the spread saved and the risk of a call, and it disappears for distressed borrowers. Figure 2 shows \(\lambda\) at a 300 basis point spread across annual call probabilities from 0.5 to 5 percent, for losses per call of 4.9, 10 and 37 percent. With development banks’ recovery record it stays above 12 even at a 5 percent call probability. At a 37 percent loss it falls from about 16 to about 1.6, and at 150 basis points it is 1.4 at a 3 percent call probability and falls below 1 above 4 percent, where guarantee capacity offers no advantage over cash. A saving of 200 basis points, the World Bank’s reported expectation for Kenya’s guaranteed loan (Muiruri 2026), needs $5.0 billion of capacity to match the reform’s cost; the funder’s expected cost is then $15 million in the base case and $429 million in the stress case, ratios of 53 and 1.8.
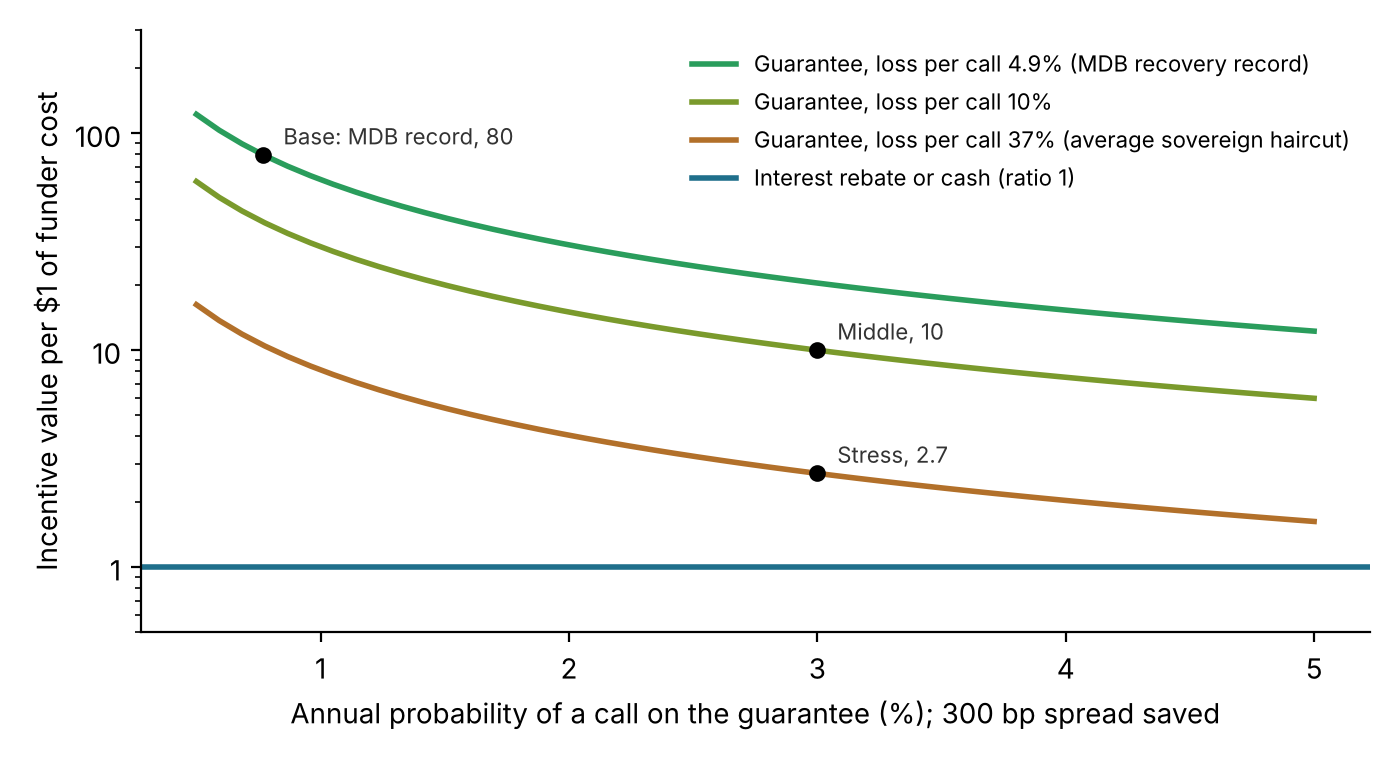
2.Source/make_wp_figures.py.
Three assumptions deserve scrutiny, and Section 8.1 takes the most important. A 300 basis point saving assumes that a guarantee from a highly rated guarantor removes most of the spread on a sub-investment-grade sovereign’s green borrowing, which holds only if the guarantee is credible and covers the risk investors price. The base case assumes the guarantor’s losses look like development banks’ own sovereign record. And full use of capacity assumes a pipeline of eligible borrowing; a government with no projects to finance gains little from guarantees.
7 Institutional delivery
7.1 The trusted intermediary
The intermediary in the SLIDI design is a small, specialized development bank (Estevão et al. 2024). It borrows by issuing fixed-coupon bonds backed by guarantees from a coalition of advanced economies, lends to governments as codified sustainability-linked loans at a higher fixed rate, and pays interest refunds when verified KPIs are met. The spread covers its operating costs and expected losses; the coalition’s guarantees cover the tail. Development agencies monitor the indicators and help governments meet them. The intermediary could be a financial intermediary fund managed by a multilateral development bank or a separately capitalized vehicle. Lending to many countries also answers Svensson’s commitment problem: a funder that has committed a reward pool to a group of countries and published the price per unit of outcome can pay the countries that perform without being tempted to rescue those that do not (Svensson 2003).
The refunds need a funder, and they should come from outside the lender’s existing envelope. Uruguay’s rebate is paid by a dedicated World Bank fund rather than by other borrowers (World Bank 2023a). That is the right principle. If a government undertakes a difficult reform and receives climate finance that is offset by less concessional finance elsewhere, it has been paid nothing, and the incentive loses its credibility for everyone watching (Stretton 2026h).
7.2 From rebate to guarantee capacity and collateral
The step from a codified loan to scale is to let the same verified indicators earn a larger prize. Under the notional capitalized value, a country’s climate balance, credited for carbon stocks and low emissions and debited for business-as-usual emissions, sets its guarantee capacity on eligible green borrowing (Stretton 2026e). Meeting a KPI from the codified menu would add to the balance at the published price. Under the Climate Investment Trust, meeting a KPI would credit the country’s beneficiary account, which can be pledged as collateral now and withdrawn after 2050 (Stretton 2026g). In both, the reward arrives in a form the government can use immediately, which also eases the timing problem of Section 4.4.
The two routes fit together in one contract. The sustainability-linked loan supplies the agreed indicator, the baseline, verification and a price. The guarantee supplies the size. One verification report can trigger both the interest refund and the increase in guarantee capacity. The refund is then a visible, annual signal, and the guarantee capacity the incentive. Kenya’s reported program, a sustainability-linked loan with a World Bank credit enhancement (Muiruri 2026), would be a first step toward this combination, with the guarantee lowering the price of the whole loan rather than serving as the reward for performance.
7.3 Relation to policy crediting and conditional de-risking
Sustainability-linked lending, policy crediting and conditional de-risking reward the same thing in different currencies. Policy crediting pays cash per tonne cut by a policy, measured as a carbon-price equivalent (Stretton 2026c, 2026b). It is the most direct and the most expensive, because every dollar of incentive is a dollar of donor cash, and it faces the counterfactual problem of measuring tonnes against what would have happened. Sustainability-linked lending pays in interest and measures outturns against a pledge-based target, which sidesteps part of the counterfactual problem at the cost of rewarding some outcomes the policy did not cause (a high \(q_0\)). Conditional de-risking pays in guarantees for a specific clean power pipeline in return for specific reforms (Stretton 2026a). The codified pricing schedule of Section 4.5 connects them: it states every reward per tonne-equivalent, so a funder can compare a dollar spent through each.
The guarantee capacity earned under Section 7.2 can stand behind the structures of series 3. A country that meets its indicators gains capacity that multilateral development banks can use for the payment intermediary of Stretton (2026a), so the incentive and the de-risking draw on one balance sheet.
8 Risks and objections
8.1 The strongest objection: the leverage rests on preferred-creditor treatment
The strongest objection is that the base case mixes two populations. The 300 basis point saving is a market spread: what investors charge a sub-investment-grade sovereign. The base-case expected loss, 0.038 percent a year, is development banks’ record on their own sovereign loans, 1984–2024 (European Investment Bank 2025), and that record reflects preferred-creditor treatment: governments in distress keep paying the banks while they restructure other debt. A guarantee of market debt is a claim of the kind the market prices at 300 basis points. If governments treat a guarantor’s claim like a market claim, its losses will look like the stress case, 3 percent of exposure called a year and 37 percent lost, an expected loss of 1.1 percent a year. A spread of 300 basis points against that expected loss gives a ratio of 2.7, roughly what the evidence on high-yield spreads implies (Huang and Huang 2012).
The objection is right about the stress case and does not overturn the conclusion. First, even on market-like losses guarantee capacity beats cash, 2.7 to 1 at 300 basis points, although at 200 basis points the multiple falls to 1.8 and at 150 basis points it reaches 1 at about a 4 percent call rate. Second, the base case is attainable when the guarantor is a development bank, or is backed by one, and the guaranteed government signs a counter-indemnity that makes a called guarantee a debt to that bank, which is how development bank guarantees work. The government’s own exposure then does not disappear: it becomes smaller, contingent and contracted (Stretton 2026a). Third, a new facility can price on the development banks’ record but hold the stress-case buffer, $310 million in the coal example rather than $16 million, until it has a record of its own; the Climate Investment Trust exists to hold it (Stretton 2026f). A buffer held in safe assets costs nothing net, so the multiple stays at about 80; if holding it costs 2 percent a year, the funder’s cost rises to $58 million and the multiple falls to about 13. What the objection does establish is that the multiple of 80 is an upper end, and that the stress case must be reported wherever 80 is.
8.2 Guarantees move risk; they do not remove it
Expected loss is an average; in a correlated global shock several guaranteed sovereigns default together and the guarantor’s loss can be many times the expected loss. The buffer cost in Proposition 4 is the price of holding capital against that tail, and the leverage stays above one unless the buffer is very large or very expensive. With the base-case parameters, \(\lambda\) stays above one as long as the buffer cost \(b\,r_b\) is below 296 basis points of capacity a year, and in the stress case below 189; a 2 percent carry on the stress-case buffer of 9.3 percent costs 19. The leverage figure is only as good as the default and correlation assumptions behind it, which should be stress-tested before any guarantor commits.
8.3 Weak targets and greenwashing
A codified menu can still carry soft targets if the margin over the pledge is small or the pledge is weak. Corollary 1 shows the cost: with \(q_0 = 0.6\), the funder pays three dollars for each dollar of policy cost it induces. The defenses are a peer-based floor on targets (Section 4.2), a published margin by indicator, and verification by a named third party from the national inventory.
8.4 Indicators that move for other reasons
Outturn indicators move with weather, commodity prices and growth as well as policy. Uruguay’s KPI uses a truncated five-year average to smooth weather (Ministry of Economy and Finance, Uruguay 2023), and because it divides by output, a smaller herd does not by itself count as success. Every indicator in the menu should be normalized and smoothed in the same way. Residual noise raises \(q_0\) for some countries and lowers it for others; across a portfolio of countries it is partly diversified, which is another reason to pay rewards through an intermediary.
8.5 Accounting and fiscal treatment
A KPI-linked rate creates contingent flows that accounting rules may treat differently from fixed-rate debt. For the borrower, the debt is recorded at its contractual terms and the rebate as a contingent reduction in interest; for the lender, the rebate is a cost that must be funded, which is why Uruguay’s is pre-funded by a dedicated fund. Guarantee capacity creates a contingent liability for the guarantor and, through counter-indemnity, for the government. These treatments should be settled once, at the level of the codified instrument, rather than deal by deal.
8.6 Moral hazard and reversal
A government could meet its indicators, collect guarantee capacity and then reverse the policy. Rewards paid annually for continued performance, as in Uruguay’s loan, limit this: the rebate stops when the indicator falls back. Guarantee capacity can be made to decline with the indicator, as the notional capitalized value is debited for emissions (Stretton 2026e). Capacity already used cannot be withdrawn without hurting investors, so the intermediary should release it gradually.
8.7 Fairness
Rewarding outperformance of pledges rewards countries that pledged little and then did more over countries that pledged much. Peer-based floors reduce this, and the pricing schedule can pay for the level of an indicator as well as for outperformance. Guarantee capacity is worth most to countries that borrow; low-income countries with little market access gain more from beneficiary-account credits than from guarantees.
9 Policy implications
Multilateral development banks should publish a codified sovereign sustainability-linked loan: an indicator menu measured as outturns, baselines set at the country’s own Paris pledge plus a published margin with a peer-based floor, one verifier and one methodology per indicator class, and a pricing schedule stated per tonne of carbon-price equivalent. The World Bank’s Uruguay loan is the template, and its own roadmap already calls for standardized buy-downs (World Bank Group 2022); the task is to remove the bespoke parts so that the tenth loan costs a fraction of the first. The cost is the design work and the funding for rebates; the risk is that a standard menu fits some countries badly, which a menu of eleven indicators with country choice limits.
Advanced economies and development banks should set up a trusted intermediary that issues fixed-coupon bonds and lends as codified sustainability-linked loans with interest refunds, rather than encourage more market sustainability-linked bonds with variable coupons. A market bond can help a government that wants to commit, but it cannot pay for a reform. A missed target should cost the government its refund, not pay bondholders a premium. The recommendation fails if the intermediary cannot borrow more cheaply than its borrowers, which requires credible guarantees from its sponsors.
Donors should make guarantee capacity under the notional capitalized value, or credits to beneficiary accounts in the Climate Investment Trust, the main reward for meeting the indicators, and fund the buffer that stands behind it rather than the rebate. If the guarantor’s claims keep development banks’ preferred-creditor record, each dollar of guarantor cost buys about 80 dollars of incentive; on market-like losses, 2.7; under a rebate or policy crediting in cash, one. The facility should hold the stress-case buffer until it has its own loss record; at a 2 percent carry that lowers the multiple on the record to about 13. The recommendation fails for countries in or near debt distress, where default risk erodes the leverage, and for countries with no pipeline of green borrowing, which should receive account credits instead.
Rewards must be additional. A rebate or guarantee that displaces other concessional finance pays the government nothing and teaches every other government that reform is not rewarded.
10 Conclusion
Sustainability-linked sovereign lending works as a contract and fails as an incentive. Uruguay’s loan shows that a government, a development bank and a verifier can agree an outturn indicator, a baseline anchored to the Paris pledge and a schedule of rewards. But a market bond pays the government nothing that it did not pay for, and an interest rebate is bounded by the interest bill: at the scale of current deals it is worth a few million dollars against reform costs in the hundreds of millions. Codifying the instrument makes it cheap to repeat; paying the reward from outside makes it an incentive rather than a commitment the government buys from itself; and making guarantee capacity the reward gives it size at a fraction of the cost of cash.
The main limitation is the calibration: the leverage of guarantee capacity rests on a stylized spread and on whether a new guarantor’s claims would be honored like development bank loans, and the cost of the coal example is illustrative. The next step is to calibrate Proposition 4 for named countries, with their market spreads and default histories, and to price the indicator menu in tonnes for two or three countries that might pilot a codified loan.
Downloads
References
Appendix B: Proofs
Proposition 1. The government’s expected net benefit is \(q_1 V - K\) if it adopts and \(q_0 V\) if not. It adopts if and only if \(q_1 V - K \ge q_0 V\), that is, \(V \ge K/(q_1 - q_0)\). The funder’s expected payout when the government adopts is \(q_1 V\); at \(V = V^*\) this is \(K q_1/(q_1 - q_0)\), which exceeds \(K\) if and only if \(q_0 > 0\). Corollary 1 is the ratio \(q_1 V^*/K\). Corollary 2: a reward of market present value \(V\) paid \(\tau\) years after the cost has political present value \(V[(1+r)/(1+\rho)]^\tau\); setting this equal to \(V^*\) gives the factor. \(\square\)
Proposition 2. Let the coupon be \(c_F\) if the target is missed and \(c_F - \Delta\) if it is met. (i) After the debt is contracted, the government’s expected annual payment is \(c_F - q_1\Delta\) if it adopts and \(c_F - q_0\Delta\) if not; the difference, \(\Delta(q_1 - q_0)\), does not depend on who receives the payments, so it is the same under a market bond and under a third-party reward of the same size. (ii) Investors anticipate the action and price the bond at \(q = q_a\). The expected coupon is \(c_F - q\Delta\) and its standard deviation \(\sigma = \Delta\sqrt{q(1-q)}\). A competitive investor requires \(c_F - q\Delta = y - \ell + \theta\sigma\), where \(y\) is the yield on the issuer’s ordinary bond. The government’s expected payment is therefore \(y - \ell + \theta\sigma\): relative to an ordinary bond, the KPI terms cost \(\theta\sigma\) in expectation and the label saves \(\ell\), which does not depend on the action. The same holds for any split of the swing between step-up and step-down. (iii) Under a fixed coupon \(y\) and a third-party reward \(\Delta\) on success, the government’s expected payment is \(y - q\Delta\); a third party requiring \(\theta_I\) per unit of \(\sigma\) bears expected cost \(q\Delta + \theta_I\sigma\). (iv) Subtracting, the government’s expected payment is lower under (iii) by \(q\Delta + \theta\sigma\), ignoring the label, which either design can carry. The resource cost of bearing KPI risk is \(\theta\sigma\) under (ii) and \(\theta_I\sigma\) under (iii); the rest, \(q\Delta\), is paid by the funder and received by the government. Corollary 3: before issuing, the government compares not issuing (payoff 0) with issuing and then adopting, which it will do ex post if \(\Delta(q_1-q_0)A_T D \ge K\); its ex ante payoff from issuing is \((\ell - \theta\sigma)A_T D - K\), which is non-negative only if \(\ell A_T D \ge K + \theta\sigma A_T D\). \(\square\)
Proposition 3. A rebate cannot make interest negative, as Uruguay’s loan states explicitly (Ministry of Economy and Finance, Uruguay 2023), so \(\Delta_t \le i\). Then \(V = \sum_t \delta^t \Delta_t D_t \le i \sum_t \delta^t D_t\). For a bullet loan, \(\sum_t \delta^t D_t = D A_T\). Combining with Proposition 1, the policy can be induced only if \(i D A_T \ge K/(q_1 - q_0)\). With a constant step \(\Delta\), replace \(i\) by \(\Delta\). \(\square\)
Proposition 4. The government saves \(s\) per dollar of guaranteed borrowing per year, on \(uG\) of borrowing, for \(T\) years: \(V = u s G A_T\). The guarantor expects to lose \(\pi L\) per dollar of drawn exposure per year and pays \(r_b\) on capital \(b\) per dollar of capacity: \(C_G = (u\pi L + b r_b) G A_T\). The ratio is \(\lambda = us/(u\pi L + b r_b)\), which exceeds 1 if and only if \(us > u\pi L + br_b\). Corollary 4 divides the funder’s cost \(q_1 V^*\) by \(\lambda\). The thresholds in Section 8.2: with \(u = 1\) and \(s = 300\) basis points, \(\lambda > 1\) if and only if \(b r_b < 300 - \pi L\) basis points: 296 in the base case (\(\pi L = 0.0077 \times 0.049\), about 4 basis points), 270 in the middle case (30) and 189 in the stress case (111). \(\square\)
Appendix C: Calibration, code and sources
All numbers in Section 6 are produced by 2.Source/model.py (run python3 model.py), and the figures by 2.Source/make_wp_figures.py. Public inputs are the Uruguay loan’s terms (Ministry of Economy and Finance, Uruguay 2023), the Uruguay bond’s terms (Oriental Republic of Uruguay 2023) and the development banks’ sovereign default and recovery rates (European Investment Bank 2025). Other parameters are stylized: a 5 percent discount rate; a 2 GW coal retirement running 6,000 hours a year at 0.95 tCO₂/MWh; a net policy cost of $100 million a year for ten years; a 6 percent loan rate; a 300 basis point spread saved, with 200 basis points as a sensitivity; and full use of capacity. The guarantee loss cases are the series 4 cases shared with Stretton (2026e) and Stretton (2026g): base, development banks’ record of a 0.77 percent annual probability of a call and a 4.9 percent loss per call, buffer 0.5 percent of capacity; middle, 3 percent and 10 percent, buffer 2.5 percent; stress, 3 percent and 37 percent (Cruces and Trebesch 2013), buffer 9.3 percent. Buffers are sized for a 1 percent annual chance of exhaustion across 20 programs with correlation 0.2 and held in safe assets at no net carry, with a 2 percent carry as a sensitivity.
Chile’s terms are from the Ministry of Finance’s bond report, whose website could not be reached when this version was checked; the step-up size and date were confirmed through extracts of that report and the coupon and date through the issuer’s counsel (Cleary Gottlieb 2022a). Kenya’s program is reported in the press (Muiruri 2026) and its terms had not been confirmed in a World Bank document. The next version should calibrate the leverage for named countries with their market spreads and default histories.
Footnotes
The fixed-coupon, third-party-reward design in Section 4 and Section 5 (Sustainability-Linked Intermediated Debt Instruments, or SLIDIs) was developed jointly with Marcello Estevão and Nils Zimmermann (Estevão et al. 2024), building on Estevão’s earlier unpublished note on bonds with key performance indicators. The propositions, the size analysis and the link to guarantee capacity are new here, and any errors are mine. The paper uses only public documents to describe World Bank practice.↩︎