The Climate Investment Trust: Hold Capital, Lend Its Strength
A buffer fund that insures policy guarantees, invests in clean energy and holds national climate accounts
Large international rewards for national climate policy fail because donors will not vote for cash transfers on the needed scale and governments cannot borrow against promised payments. I propose a Climate Investment Trust that holds donor capital rather than spending it, and uses one pool three ways: as second-loss cover behind the guarantees that reward policy, as a fee-earning co-investor in clean energy and in regional first-loss funds, and as national beneficiary accounts that countries pledge as collateral now and draw only after 2050. I derive the buffer that keeps the annual chance of exhaustion at 1 percent, and show that each dollar held delivers interest savings equal to the spread saved divided by the Trust’s expected loss rate, when the buffer earns what donors would otherwise earn. On the development banks’ sovereign loss record that is about 80 dollars per donor dollar (63 at a 2 percent carry); without their preferred-creditor status, in a stress case, $5 billion supports $54 billion of guarantees and delivers 2.7. A Trust that holds the stress-case buffer grows on its own yield if losses follow the banks’ record, and needs fees if they do not. An allocation rule built as a feebate between accounts rewards early action at no net cost.
climate finance, guarantees, buffer capital, trust funds, sovereign incentives, preferred creditor status
Working paper, version 0.3, October 2026. Stephen J. Stretton, writing in a personal capacity. The views expressed are the author’s own and do not represent those of any institution with which he is or has been affiliated. A short version for policy makers is Climate Fiscal Policy Brief No. 4.2.1
1 Executive summary
Policy brief (short version) → · Download this paper (pdf) · Slides (pdf)
The reward for national climate policy has to come from outside, and cash on the needed scale will not come. Cutting emissions pays off for the world, while the cost falls on the government that cuts. Paying $100 a tonne for a 10 percent cut in fossil carbon dioxide would cost about $380 billion a year; the Tropical Forest Forever Facility, the most ambitious new climate fund, launched in November 2025 with $6.7 billion of pledges against a $25 billion target.
Guarantees can deliver a large reward cheaply, if someone holds the capital behind them. A guarantee saves a government the whole credit spread on its borrowing, but costs the guarantor only the losses it expects. This paper proposes a Climate Investment Trust to hold that capital. Donors fund it and hold its votes; its beneficiaries are the post-2050 populations of participating countries, through national accounts that countries can pledge as collateral now. One pool does three jobs: it stands second behind the government on policy guarantees, with a AAA-rated backer behind it; it co-invests in clean energy through a separate investment function and regional funds; and it credits its surplus to national accounts by performance.
On the development banks’ loss record, each donor dollar held delivers about 80 dollars of interest savings. Their sovereign loans defaulted at 0.77 percent a year over 1984–2024, and they recovered 95.1 percent. On that record a buffer of 0.5 percent of guarantee exposure keeps the annual chance of exhausting it at 1 percent, and a 3-point spread saving divided by an expected loss of 0.038 percent a year gives about 80, against one for a fund that pays out; 63 if the buffer earns 2 percent less than donors could elsewhere.
The record belongs to the banks, so the paper also reports a stress case. Governments keep paying development banks in a crisis because they treat them as preferred creditors, an informal practice a new trust might not inherit. With calls at 3 percent a year and losses of 37 percent, the average in sovereign restructurings, the buffer must be 9.25 percent: $5 billion supports $54 billion of guarantees and delivers 2.7 per dollar. A Trust that holds this buffer while its losses follow the banks’ record delivers about 13 per dollar at a 2 percent carry, not 80, until its own record lets it hold less.
Calls need cash before recoveries arrive, so the Trust also needs a liquidity line. A called guarantee costs a year’s debt service at once, even if almost all of it is recovered later. If the buffer pays that cash itself, $5 billion on the banks’ record supports about $390 billion of guarantees, not $1 trillion.
Whether the Trust grows without new money depends on the losses it actually suffers. Holding the stress-case buffer, it earns more on its safe assets than it loses if losses follow the banks’ record, and grows by about 3 percent a year with no fee. At stress-level losses it shrinks by 8.5 percent a year unless it charges about 0.8 percent of exposure or earns fees on private co-investment. With $95 billion of private equity paying a quarter of a 10 percent return, an upper case, it reaches $34 billion after 10 years on the banks’ record and levels off near $28 billion in the stress case.
A feebate between accounts rewards performance and early action at no net cost. Accounts are credited for emissions intensity below the participants’ average and debited above it; the transfers cancel, and a deduction from a balance held in trust can be enforced where a charge on a sovereign cannot. Balances limit the rate: about $8 per tonne at launch in a stylized ten-country power sector, $31–57 per tonne after 10 years.
What to do. Donors and a development bank should launch the Trust as a buffer behind the guarantee capacity proposed in the companion paper, with capital in high-grade bonds, a liquidity line from its AAA backer, and claims booked through a development bank so that they keep preferred-creditor treatment. They should publish the allocation rule, the guarantee fee and the exhaustion target first, hold the stress-case buffer until the Trust’s own record is known, and add investment later.
2 Introduction
Climate mitigation pays off globally while its costs fall on national budgets, so the reward for national climate policy has to come from outside, and the obvious ways to pay it fail on their own arithmetic. Fossil carbon dioxide emissions were about 37.8 billion tonnes in 2024, 12.3 billion of them in China (Friedlingstein et al. 2026). A global carbon tax of $100 per tonne on fossil CO₂ alone would raise about $3.8 trillion a year, $1.2 trillion of it in China, before any revenue was recycled. A global subsidy at the same rate that cut those emissions by a tenth would cost about $380 billion a year and, paid against negotiated baselines, would reward governments for waiting (Stretton 2026j, ch. 20). Even modest pooled funds are hard to raise: the Tropical Forest Forever Facility, launched in November 2025 to pay for standing forest, had pledges of $6.7 billion against a $25 billion target for its sponsor capital (Barber et al. 2025).
This paper asks what institution can stand behind large guarantee-based incentives for climate policy, at a donor cost that is politically possible, and grow without fresh donations.
The answer is a trust that holds capital instead of disbursing it. Donors fund the Climate Investment Trust and hold its votes. Its formal beneficiaries are the post-2050 populations of participating countries, through national beneficiary accounts that can be pledged as collateral now and drawn only later. The Trust does three jobs with one pool. It takes second loss on policy guarantees: the government takes first loss, the Trust second, and a AAA-rated entity stands behind both. It co-invests in the construction stage of clean energy projects and seeds regional funds that hold the first-loss tranche of operating portfolios. And it credits its surplus to national accounts by participation and performance, deducting for policy reversed. Because a guarantee is worth its full spread saving to the borrower but costs the guarantor only its expected loss, a buffer delivers many times the incentive of the same money paid out.
The paper makes three contributions, each a proposition with its conditions stated. The first sizes the buffer and its leverage (Section 5.2). In a one-factor model of guarantee calls (Vasicek 2002; Gordy 2003), the buffer for a 1 percent annual chance of exhaustion is 0.5 percent of exposure on the development banks’ sovereign loss record and 2.5 to 9.25 percent in less favorable cases. The interest savings delivered per donor dollar equal the spread divided by the Trust’s expected loss rate when the buffer earns donors’ discount rate, about 80 on the banks’ record, 10 in a middle case and 2.7 in a stress case; with a carry the buffer ratio enters, and at 2 percent the figures are 63, 8.6 and 2.3. The proposition also states the liquidity the buffer needs, which earlier versions ignored. The second gives growth dynamics (Section 5.3): a buffer grows on its own only if its yield beats its expected losses, which holds for a Trust that holds the stress-case buffer while its losses follow the banks’ record, and otherwise needs guarantee fees or fees on private co-investment, whose growth slows as the Trust catches up with them. The third gives an allocation rule (Section 5.4), a feebate between beneficiary accounts that balances its budget, rewards each tonne cut, makes waiting costly and can be enforced only because deductions come from balances held in trust.
The closest institutions are the IMF’s Resilience and Sustainability Trust, which lends reserve assets channeled through loan, deposit and reserve accounts (International Monetary Fund 2022), and the Tropical Forest Forever Facility, which puts sponsor capital in a junior position beneath market debt and pays forest countries from the spread (Government of Brazil 2025). The Climate Investment Trust differs from both: it insures rather than lends or invests for a spread, and its accounts belong to beneficiaries who cannot yet draw them. The literature on development bank capital explains why a buffer behind sovereign guarantees can be thin: governments treat the banks as senior creditors in practice (Schlegl et al. 2019), rating methods give that too little credit (Perraudin et al. 2016), and the G20’s review urged shareholders to stretch the banks’ capital accordingly (G20 Expert Panel on Multilateral Development Banks’ Capital Adequacy Frameworks 2022). This paper asks what happens outside the banks’ balance sheets, where that treatment is not given, and makes the answer the stress case. Relative to climate clubs (Nordhaus 2015), which penalize non-members, the Trust rewards members, and it supplies the enforcement device that an international feebate lacks (Stretton 2026i, ch. 5).
The paper is the institutional half of a pair. Its companion proposes a notional capitalized value for each country, a climate balance credited for carbon stocks and low emissions and used as guarantee capacity on the country’s green borrowing (Stretton 2026h, 2026g). The Trust funds the buffer behind that capacity. It can also deliver the reward in sustainability-linked sovereign lending (Stretton 2026b, 2026a), and its regional funds supply the first-loss equity beneath the portfolio bonds of paper 3.2 (Stretton 2026e, 2026d).
3 Precedents and literature
Development banks lose very little on sovereign loans because governments treat them as preferred creditors, and that treatment is informal. The banks’ sovereign and sovereign-guaranteed loans defaulted at 0.77 percent a year over 1984–2024, and 95.1 percent of the amounts in default was recovered; the default rate partly reflects a change in how the GEMs consortium reports sovereign lending (European Investment Bank 2025). Market creditors fare far worse: the average haircut in 180 sovereign restructurings with foreign banks and bondholders between 1970 and 2010 was 37 percent (Cruces and Trebesch 2013). The difference is seniority in practice. Repayment data show that the IMF and World Bank are senior creditors, while bilateral official lenders are not even senior to private ones (Schlegl et al. 2019). The G20 review of the banks’ capital frameworks calls preferred creditor treatment the key reason for the banks’ “extremely low” losses and stresses that it “is informal, with no binding statutory or contractual status” (G20 Expert Panel on Multilateral Development Banks’ Capital Adequacy Frameworks 2022). A new vehicle therefore cannot assume it.
Shareholders have begun to let development bank capital be stretched, but only inside the banks. The G20 review, published in 2022, recommended that shareholders redefine risk appetite, give credit for callable capital, use financial innovations such as hybrid capital, engage with rating agency methods and improve the governance of capital adequacy (G20 Expert Panel on Multilateral Development Banks’ Capital Adequacy Frameworks 2022). Perraudin et al. (2016) show that a standard rating agency method is highly conservative about concentration and gives too little allowance for preferred creditor status. Every step of this kind consumes the banks’ own capital and needs their shareholders’ consent, and climate incentives work only if they are additional to the existing lending envelope (Stretton 2026j, ch. 18). A separate vehicle with its own capital can protect a bank’s guarantees without consuming its balance sheet.
Hybrid capital and SDR rechanneling show that reserve assets can become loss-absorbing capital. On 10 May 2024 the IMF Executive Board allowed members to channel up to SDR 15 billion (about $20 billion) of special drawing rights into hybrid capital of approved development banks; the African and Inter-American development banks expected to lend about four times what they received (Plant 2024). Hybrid capital absorbs losses before senior creditors. It is the closest existing instrument to the Trust’s second-loss position, but it is capital of a single bank and earns nothing for the countries whose borrowing it supports.
IFFIm shows that binding donor commitments can be turned into money now, with a reserve held back. Since 2006 the International Finance Facility for Immunisation has turned long-term, legally binding donor pledges into bonds whose proceeds fund Gavi immediately, with the World Bank as treasury manager; it borrows against only part of the pledges and keeps the rest as a reserve (International Finance Facility for Immunisation 2026). IFFIm front-loads spending. The Trust uses the same reserve logic for the opposite purpose: it holds capital so that it is spent only on losses.
The IMF’s Resilience and Sustainability Trust shows that donor capital can be lent rather than given, with a reserve to protect it. The IMF Executive Board approved the RST on 18 April 2022, with a loan account, a deposit account and a reserve account that builds buffers against financial risk (International Monetary Fund 2022); it opened in October 2022 and lends at a 20-year maturity with a 10½-year grace period, while keeping contributors’ claims safe and liquid enough to retain their reserve-asset character (International Monetary Fund 2025b). Pledges reached SDR 35.8 billion ($48.9 billion) by 28 July 2025 (International Monetary Fund 2025a). The 2024 version of this proposal took the RST’s accounts as its model (Stretton 2024). The difference is that the RST’s resources are owed back to contributors, while the Trust’s accounts belong to beneficiaries.
The Tropical Forest Forever Facility is the nearest working example of a junior-senior pool that pays for a stock. It targets $25 billion of sponsor capital and up to $100 billion of senior debt, about 80 percent of the capital base. Sponsor capital can be paid-in capital, notes, concessional loans, guarantees or grants, at a cost near long-dated US Treasury yields, repaid over 30 years after a 10-year grace period. The pool is invested in liquid public and corporate bonds, and the spread over its cost of funds pays forest countries about $4 per hectare of eligible forest a year, conditional on deforestation at or below 0.5 percent a year; each hectare deforested cuts the payment by the equivalent of 100 to 200 hectares, and each hectare degraded by fire by 35. At least 20 percent goes to Indigenous peoples and local communities, and the World Bank is the prospective trustee (Government of Brazil 2025). Pledges stood at $6.7 billion at launch (Barber et al. 2025); the United Kingdom and the Netherlands joined in 2026, and the facility expects to operate by mid-2027 (Reuters 2026). It shows that donors will put capital in a junior position and that a pool can reward a stock. It pays out each year, its incentive is bounded by the spread it earns, and it insures nothing.
Blended equity vehicles exist, but at a far smaller scale than the Trust’s investment function assumes. Climate Investor One, which finances clean energy projects from development through all-equity construction to refinancing, closed its development and construction equity funds at a combined $850 million in 2019, with public backers including the Green Climate Fund and the European Union (FMO 2019). Across developing countries, each dollar of blended development finance mobilized $0.75 of private money in 2012–2015, and $0.37 in low-income countries (Attridge and Engen 2019).
Portfolio credit risk theory supplies the buffer arithmetic. In the one-factor model, each obligor’s creditworthiness depends on a common factor and an idiosyncratic shock, and as the portfolio grows its loss rate converges to a deterministic function of the common factor (Vasicek 2002). The capital needed for a given confidence level then depends only on default probabilities, loss given default and correlation, which is the foundation of ratings-based bank capital rules (Gordy 2003).
International climate economics explains why incentives must come from outside and why they are hard to pay. Climate clubs overcome free-riding by penalizing non-members through trade (Nordhaus 2015). Results-based climate finance rewards measured cuts against baselines, which invites strategic delay. An international feebate on national carbon intensity would net to zero and move far less money than a tax, but it requires sovereigns to pay their peers, which they will not do (Stretton 2026i, ch. 5).
The gap is an institution that holds loss-absorbing capital for climate policy guarantees, says what it can safely support without preferred-creditor status, grows, and allocates its gains by performance. The banks’ capital is bound by their shareholders’ envelopes; hybrid capital and the RST are owed back to their providers; the forest facility pays out and insures nothing. None sizes a buffer against guarantee calls for both the banks’ record and a record without their seniority, sets out when it grows without new donations, or supplies the enforcement device that an international feebate needs.
4 The Trust: funding, control and benefit separated
A trust separates who pays, who decides and who benefits, and the Climate Investment Trust uses all three separations. Donor countries fund it and hold the voting shares. A multilateral development bank manages it under its trust fund rules. The formal beneficiaries are the post-2050 populations of participating countries: each country has a beneficiary account, credited by participation and performance, that becomes withdrawable after 2050. A global account holds capital not yet allocated to any country and meets the first guarantee calls. Developing countries can also contribute, in which case their own future populations are the beneficiaries.
Countries benefit long before 2050, through collateral rather than cash. An account that grows and cannot yet be drawn is still an asset, and an asset can be pledged. A country can pledge its account as additional cover behind its own guarantees, which lowers the rate it pays on guaranteed green borrowing, or as collateral for sustainability-linked loans. The account rewards and secures at the same time. Accounts are also where the companion paper’s notional capitalized value goes when guarantees cannot use it: a country’s balance above what its green borrowing needs can flow into its beneficiary account, and a country that borrows too little for guarantee capacity to bind can instead receive interest on its balance, paid into the account (Stretton 2026h).
Deductions make the incentive two-sided. The Trust credits accounts for policy adopted and kept, and deducts for policy reversed. Taxing a sovereign is infeasible; deducting from a balance it does not yet control is not. A payment to a government can be reversed by the next government. An account held for the country’s future population, which grows when the country acts and shrinks when it retreats, creates a constituency for persistence (Stretton 2026j, ch. 20).
The Trust does three jobs with one pool of loss-absorbing capital. Time and Chance presents the same pool under five names: a risk equity fund, a clean energy equity fund, a policy-lending fund, a Climate Investment and Insurance Fund, and the Climate Incentives Trust (Stretton 2026j, ch. 14). They are views of one structure. This paper uses one name, the Climate Investment Trust, and one vocabulary for who loses first, set out in Table 1.
| Setting | First loss | Second loss | Behind |
|---|---|---|---|
| Policy guarantees (a government guarantees a contractual policy commitment, such as guaranteed-price auction contracts or a sustainability-linked bond) | The government, by indemnity to the guarantor, recorded as an obligation to it | The Trust’s buffer: the global account and, where pledged, the country’s own beneficiary account | A AAA-rated entity: a multilateral development bank or highly rated sovereign |
| Portfolios of operating clean power plants (paper 3.2) | A regional fund holds the first-loss tranche | Mezzanine | Senior bonds, co-guaranteed by highly rated sovereigns |
Insurance of policy guarantees comes first, because it needs no investment pipeline. A government that commits to a policy gives a guarantee: an annual auction of guaranteed-price contracts for clean power is a contract, and its value to investors depends on the probability the state honors it. The government indemnifies the guarantor, as it does under existing multilateral guarantees. If it fails to pay, the Trust pays and holds the government’s obligation, which is recovered over time. Only if the buffer is exhausted is the AAA entity called. The investor gets the credit of the strongest party; the incentive to perform stays with the government. The arrangement does not leave the government’s liabilities untouched. Its exposure becomes smaller, contingent and contracted: an obligation to the guarantor that falls due only if the government fails to honor its own commitment (Stretton 2026j, ch. 14). A Trust that acts only as a buffer, with its capital in high-grade bonds, is useful on its own and is the simplest version to capitalize and explain (Stretton 2026j, ch. 20).
Investment comes second. The Trust co-invests in the construction stage of clean energy projects, where money is scarce and a credible screen crowds others in, and sells after the plant is connected and refinanced. Through regional funds set up with regional development banks it also takes the first-loss tranche in portfolios of operating plants. Section 7 develops this job.
Allocation is the third job. The Trust credits its distributable surplus to accounts by a published rule. Section 5.4 derives one.
Private capital enters the investment function on limited terms. Pension funds and sovereign wealth funds may co-invest alongside the Trust in construction-stage equity. They pay a fee of 25 percent of their investment returns to the Trust and vote only on the investment function, not on fees, insurance or allocation (Stretton 2026j, ch. 20). The Trust keeps control of everything that affects the guarantee book.
5 A model of the Trust
5.1 Setup
The Trust holds capital \(K\) in safe assets and stands second-loss behind guarantee exposure \(G\). Exposure is spread over \(n\) equal guaranteed programs, one per participating country. In a year, country \(i\) fails to honor its first-loss indemnity with probability \(p\). Failures are correlated through a one-factor structure: country \(i\) fails when \(X_i = \sqrt{\rho}Z + \sqrt{1-\rho}\,\varepsilon_i < \Phi^{-1}(p)\), where \(Z\) and \(\varepsilon_i\) are independent standard normal and \(\rho\) is the asset correlation. When country \(i\) fails, the Trust pays the amount called and ultimately loses a share \(L\) of the program’s exposure \(G/n\), the loss given call. The expected loss rate on exposure is \(\lambda = pL\).
The borrower saves a spread \(s\) a year on guaranteed debt; the Trust may charge a guarantee fee \(f \le s\). The incentive value to the country is the present value of \(s - f\) on the guaranteed debt. The buffer earns a safe yield \(r_s\) and incurs running costs \(c\), both as shares of \(K\). Donors discount at \(d\); the carry \(\kappa = d - (r_s - c)\) is what holding a dollar in the buffer costs them each year, and it is zero when the buffer earns what donors would otherwise earn. A fund that pays rewards out is the benchmark: it delivers a dollar of incentive per dollar of capital.
The Trust targets a probability \(\alpha\) that guarantee losses in a year exceed its capital. That event is the one in which the AAA entity behind the Trust is called, so \(\alpha\) is the AAA backer’s attachment probability. The buffer ratio \(b = K/G\) is the smallest that meets the target.
5.2 Proposition 1: the leverage of a buffer
Proposition 1 (Leverage of a buffer). (a) With \(n\) equal exposures, the buffer ratio is the \((1-\alpha)\) quantile of the annual loss rate \(\ell = (L/n)\sum_i \mathbf{1}\{X_i < \Phi^{-1}(p)\}\). As \(n \to \infty\) it converges to \[ b_\infty = L\,\Phi\!\left(\frac{\Phi^{-1}(p) + \sqrt{\rho}\,\Phi^{-1}(1-\alpha)}{\sqrt{1-\rho}}\right), \tag{1}\] which rises with \(p\) and \(L\), falls with \(\alpha\), and rises with \(\rho\) whenever \(\Phi^{-1}(1-\alpha) > \sqrt{\rho}\,|\Phi^{-1}(p)|\), which holds for all \(\rho\) when \(\alpha \le p < 1/2\). A buffer of \(K\) supports exposure \(K/b\).
(b) Suppose the Trust keeps exposure at \(G = K/b\) as its capital changes, and donors discount incentive flows at \(d\). Then the present value of interest savings delivered per dollar of initial capital is \[ M = \frac{s - f}{\lambda - f + \kappa b} \tag{2}\] when the denominator is positive. With no carry (\(\kappa = 0\)), \(M = (s - f)/(\lambda - f)\), which does not depend on \(b\). A payout fund delivers 1. At no carry the buffer delivers more than a payout fund if and only if \(s > \lambda\): the spread saved exceeds the Trust’s expected loss rate.
(c) If the assets in which the buffer is held lose a share \(k\) of their value in the states that exhaust it, the buffer ratio must rise to \(b/(1-k)\).
(d) If each call requires the Trust to pay a share \(m\) of the program’s exposure in cash before it recovers anything, the buffer that keeps the chance of running out of cash at \(\alpha\) is \(\max(L, m)/L\) times the buffer in part (a), for finite \(n\) as well as in the limit.
The intuition is that a buffer is consumed only by losses, while the incentive it supports is paid every year. A dollar paid out is gone. A dollar held behind guarantees supports \(1/b\) dollars of exposure each year, on which the borrower saves \(s\), and it shrinks only at the expected rate \((\lambda - f)/b\). With no carry, equation 2 is the ratio of the incentive flow to the rate of consumption, and it does not depend on \(b\): the buffer ratio decides how much exposure a given capital supports at a moment, not how much incentive it delivers over its life. The condition \(s > \lambda\) is the series’ central claim in precise form. The market charges a sovereign a spread that covers its expected loss to market creditors plus a risk and liquidity premium; the Trust bears only its own expected loss, which is lower again if, as a preferred creditor with recovery rights on the sovereign’s obligation, it loses less than market creditors do.
The carry is what makes a thick buffer expensive. When the buffer earns less than donors could earn elsewhere, each dollar held costs \(\kappa\) a year whether or not it is ever called, and that cost is proportional to the buffer. The term \(\kappa b\) in equation 2 is the same carry that the companion paper adds to the guarantor’s cost (Stretton 2026h). It matters little for a thin buffer and a great deal for a thick one, which is why the cost of prudence is the cost of holding the stress-case buffer when losses turn out to follow the banks’ record.
Part (c) is why the buffer must not be invested in clean power. Construction-stage equity in clean energy loses value in the same crises, a sovereign debt crisis or a currency collapse, that trigger guarantee calls. A buffer half-invested in such equity, with a 40 percent fall in a stress, would need \(b/(1-0.2) = 1.25b\). Holding the buffer in high-grade bonds of other issuers sets \(k\) near zero. This resolves a tension in earlier drafts, which described the Trust both as capital “held, not spent” and as an investor in blended project equity (Stretton 2026j, ch. 20): the buffer is held; the investment function uses private capital and the Trust’s surplus.
Part (d) separates solvency from liquidity. A government that misses a payment on a guaranteed loan triggers a call for the debt service due, and recoveries come later; on the banks’ record almost all of it comes back. A buffer sized for ultimate losses can be solvent and still unable to pay. The remedy is either a thicker buffer or a liquidity line from the AAA backer that funds calls until recoveries arrive, which leaves the buffer sized for losses alone.
5.3 Proposition 2: growth and self-funding
The Trust’s capital evolves with its yield, fees, expected losses, costs and the fee on private returns. Let private investors commit equity \(E_p\) to the investment function, earning a gross return \(r_e\), of which a share \(\varphi\) goes to the Trust. In expectation, \[ \dot K = \big(r_s - c - (\lambda - f)/b\big)K + \varphi\, r_e E_p + C, \tag{3}\] where \(C\) is new contributions. Define the net burn rate \(\beta = c + (\lambda - f)/b - r_s\).
Proposition 2 (Self-funding). (a) Without private co-investment or contributions, the Trust’s capital grows if and only if \(\beta < 0\), that is, if the guarantee fee satisfies \[ f \ge \lambda - b\,(r_s - c). \tag{4}\] In particular it grows with no fee whenever \(\lambda < b(r_s - c)\): the buffer’s net yield exceeds its expected losses.
(b) With constant private equity \(E_p > 0\), no contributions and \(\beta > 0\), capital converges monotonically to \[ K^* = \frac{\varphi\, r_e E_p}{\beta}, \tag{5}\] and its growth rate \(g_t = \varphi r_e E_p/K_t - \beta\) falls as it grows. The Trust funds itself (its capital does not fall) if and only if \(K_0 \le K^*\), and it grows at a target rate \(g\) only while \(K_t \le \varphi r_e E_p/(g + \beta)\).
(c) Private investors with a required return \(r_p\) participate only if \((1-\varphi) r_e \ge r_p\). The fee income available to the Trust is therefore at most \((r_e - r_p)E_p\): the excess of the investment return over what private investors require.
The proposition settles the growth claims of earlier versions. A buffer is not a money machine. At high leverage its safe yield cannot cover expected losses unless borrowers pay most of the expected loss as a fee, and every point of fee is a point of incentive taken back from the borrower. A thick buffer earns more than it loses if losses are low, which is the case that matters for a prudent Trust (Section 6.3). Beyond that, the Trust grows because it earns a share of returns on capital that is not its own. That income is fixed by the size of the private pool, not by the size of the Trust, so growth is fastest at launch and slows as capital catches up with what the fee income can sustain. Part (c) gives the fee rule a foundation: a 25 percent fee is acceptable to private investors only if three-quarters of the gross return clears their hurdle. It is the same arrangement as the earlier dynamic incentive in which returns above an agreed cap pass to countries and dilute the original investors down to their agreed maximum (Stretton 2026j, ch. 18).
Country stakes financed by borrowing carry a cost the accounts must repay. In the indicative structure, $4 billion of the Trust’s $5 billion launch capital comes from developing countries that finance their stakes through long-term development policy lending (Stretton 2026j, ch. 20). Each such country owes the loan and owns an account of the same size. Its net position improves only if the account’s safe yield, its allocations and the value of the guarantees and collateral it secures exceed the loan rate \(i_L\). With a stake \(S_i\), the annual carrying cost is \((i_L - r_s)S_i\). The stake raises the country’s gross debt, which a debt sustainability assessment will record; the matching asset is real but not liquid until 2050.
5.4 Proposition 3: an allocation rule
The Trust allocates its distributable surplus by a rule that pays for joining and for performance. Let participating countries \(i = 1, \dots, N\) produce output \(Y_i\) in a covered sector (power, to start) at emissions intensity \(e_i\), with output share \(s_i = Y_i/\sum_j Y_j\). Let \(\bar e = \sum_j s_j e_j\) be the output-weighted average intensity. Each year country \(i\)’s account receives \[ A_i = \frac{a}{N} + \tau\,(\bar e - e_i)\,Y_i, \tag{6}\] a base allocation from the surplus \(a\) the Trust distributes, plus a feebate at rate \(\tau\) per tonne: a credit for intensity below the benchmark and a deduction above it. Account balances \(B_i\) earn the Trust’s yield. Let \(V_i\) be the annual value to country \(i\) of the guarantees it receives as a participant and \((i_L - r_s)S_i\) its carrying cost.
Proposition 3 (Allocation). (a) Budget balance: the feebate terms sum to zero, so total allocation equals the surplus distributed, \(\sum_i A_i = a\). (b) Performance: a country that cuts its emissions by one tonne through lower intensity raises its allocation by \(\tau(1 - s_i)\). A leave-one-out benchmark, the average of the other participants, raises it by exactly \(\tau\), at the cost of exact budget balance. (c) Feasibility and participation: deductions can be enforced only up to the balance, so the rule is feasible in a year if \(\tau \le \min_{i:\, e_i > \bar e} (B_i + a/N)/((e_i - \bar e)Y_i)\). A country above the benchmark joins in a static comparison only if \(a/N + V_i - (i_L - r_s)S_i \ge \tau(e_i - \bar e)Y_i\). (d) Early action: a cut of \(\Delta\) in intensity made \(k\) years later than it could have been forfeits allocations of \(\sum_{j=0}^{k-1} \tau_{t+j}(1-s_i)\Delta Y_i/(1+\delta)^j > 0\). Waiting is never free, and a declining schedule of rates \(\tau_t\) raises the cost of waiting relative to a flat schedule at the later rates.
The rule is the series 1 feebate applied between countries, and its properties carry over. Part (b) is the dominant-firm result for feebates with a current-average benchmark: a country that is a large share of the covered output partly sets its own benchmark and sees only part of the rate (Stretton 2026c). Part (a) is what makes the rule affordable: the feebate moves money between accounts but needs no net money from the Trust. Part (c) is the binding constraint, and it shows why the international feebate needs a trust. Without balances to deduct from, any positive \(\tau\) requires the most carbon-intensive participants to pay their peers, which sovereigns will not do (Stretton 2026i, ch. 5). With balances, \(\tau\) is limited by the size of the accounts relative to the deviations from the benchmark. Part (d) answers the additionality problem. A payment for cuts measured against a baseline is worth as much, or more, if the cut is made later, so it rewards waiting. A feebate is a flow earned every year a country is below the benchmark, so delay forfeits it.
Participation and strength pull against each other, and a transitional benchmark resolves the conflict. Part (c) shows that a high feebate rate drives the most carbon-intensive countries away, because their deduction exceeds what they gain from joining. Two remedies are available. The Trust can start the rate low and raise it as balances grow. Or it can give each entrant a transitional benchmark that starts at its own intensity on entry and converges to the common average on a published schedule. That is a baseline, but one fixed at entry and not a counterfactual, so it does not reward delay before entry as long as the convergence schedule is the same for every entrant, whenever it joins.
6 Calibration
6.1 Parameters
Every parameter in the calibration is stylized except the call probability, the loss given call and the launch capital, and Table 2 lists them. The model is in 2.Source/model.py, which prints every number used below.
| Parameter | Symbol | Value | Basis |
|---|---|---|---|
| Guaranteed programs | \(n\) | 20 | Stylized |
| Annual probability a government fails to honor its indemnity | \(p\) | 0.77% | MDB sovereign default rate, 1984–2024 (European Investment Bank 2025); middle and stress cases 3% |
| Asset correlation | \(\rho\) | 0.2 | Stylized, all cases; sensitivity 0.1–0.4 |
| Loss given call | \(L\) | 4.9% | One minus MDB sovereign recovery of 95.1% (European Investment Bank 2025); middle case 10%; stress case 37%, the average sovereign haircut, 1970–2010 (Cruces and Trebesch 2013) |
| Target annual probability of exhaustion | \(\alpha\) | 1% | Stylized |
| Spread saved by the borrower | \(s\) | 3 percentage points | Stylized |
| Yield on buffer assets; running costs | \(r_s\); \(c\) | 4%; 0.5% | Stylized |
| Carry | \(\kappa\) | 0 (2% as sensitivity) | Stylized; as in paper 4.1 |
| Cash paid per call before recovery | \(m\) | 13% of the program | One year’s debt service on a 10-year loan at 5%, stylized |
| Launch capital | \(K_0\) | $5bn | $1bn donor grants and $4bn country stakes (Stretton 2026j, ch. 20) |
| Rate on policy loans financing country stakes | \(i_L\) | 5% | Stylized |
| Private equity co-invested | \(E_p\) | $95bn | Indicative upper case (Stretton 2026j, ch. 20); lower case $10bn |
| Gross return on construction-stage equity; fee | \(r_e\); \(\varphi\) | 10%; 25% | One consistent set chosen here (Section 6.4) |
| Base allocation | \(a\) | $1bn a year | Stylized; $100m per country of ten |
6.2 Buffer and leverage
On the development banks’ loss record a buffer of 0.5 percent of exposure keeps the annual chance of exhaustion at 1 percent, so on paper $5 billion could support about $1 trillion of guarantees. The expected loss rate is \(\lambda = 0.0077 \times 0.049 = 0.038\) percent of exposure a year. With 20 programs a single call costs 0.25 percent of exposure in the end, and the buffer of 0.49 percent covers two calls in the same year, a leverage of about 200 times. With many small programs equation 1 gives 0.3 percent.
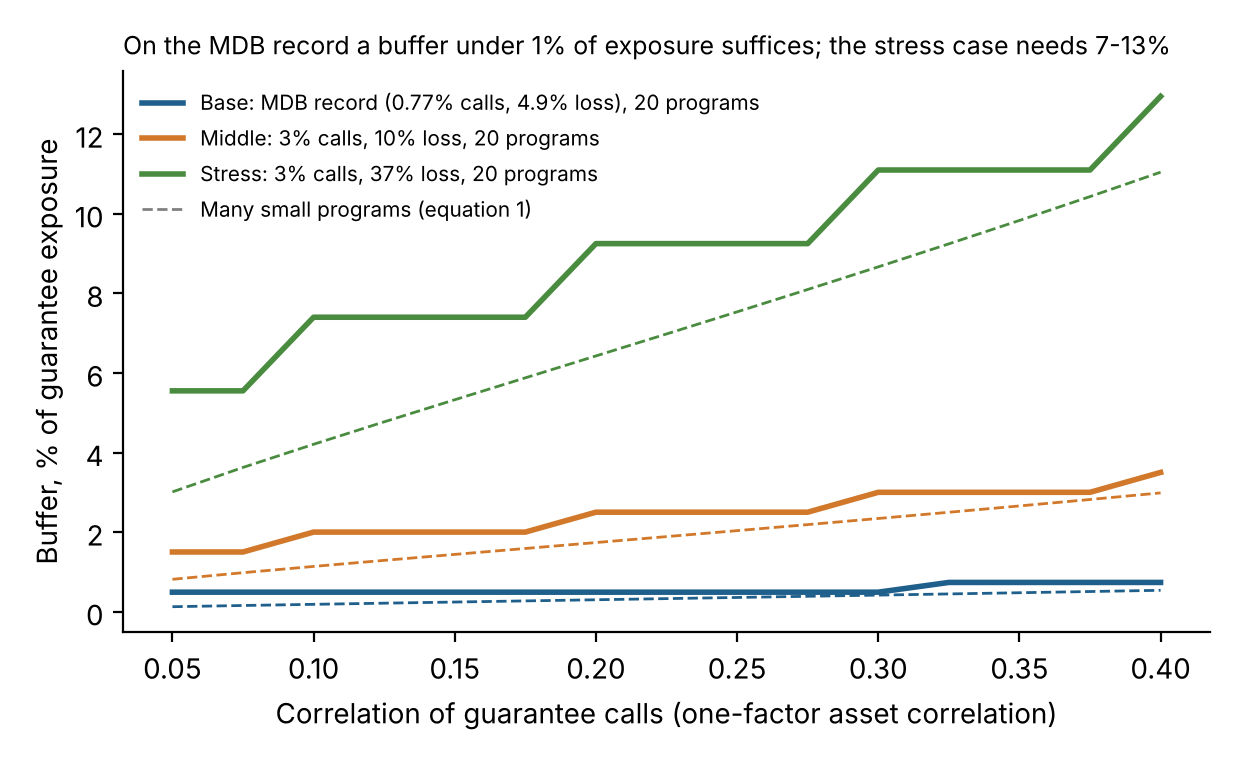
That trillion is a ceiling, not a forecast, and the Trust should start well below it. Exposure is limited by the green borrowing that participating governments actually undertake, and by what the AAA backer will accept. More important, the record belongs to the development banks. It reflects their preferred creditor treatment, which is informal (G20 Expert Panel on Multilateral Development Banks’ Capital Adequacy Frameworks 2022), and a new trust standing behind guarantees of market debt might not inherit it. Table 3 and Figure 1 therefore show two less favorable cases with the same correlation and number of programs. In a middle case, calls occur at 3 percent a year and lose 10 percent; the buffer is 2.5 percent and $5 billion supports $200 billion. In a stress case, calls occur at 3 percent a year and lose 37 percent, the average sovereign haircut; the buffer is 9.25 percent, a leverage of 10.8 times, and $5 billion supports about $54 billion. A prudent Trust would hold the stress-case buffer until its own record shows which case it is in. A tighter exhaustion target of 0.5 percent raises the base buffer to 0.7 percent and leaves the other two unchanged at 20 programs, because the loss distribution moves in steps of one failure.
2.Source/model.py.
| Case | \(\rho\) = 0.1 | \(\rho\) = 0.2 | \(\rho\) = 0.3 | \(\rho\) = 0.4 |
|---|---|---|---|---|
| Base: MDB record (0.77% calls, 4.9% loss) | 0.5 | 0.5 | 0.5 | 0.7 |
| Middle (3% calls, 10% loss) | 2.0 | 2.5 | 3.0 | 3.5 |
| Stress (3% calls, 37% loss) | 7.4 | 9.3 | 11.1 | 13.0 |
2.Source/make_wp_figures.py.
Paying calls in cash before recoveries cuts the base-case ceiling from about $1 trillion to about $390 billion. If a call costs a year’s debt service on a 10-year loan at 5 percent, 13 percent of the program, the Trust must find 0.65 percent of total exposure for each call even though it will lose only 0.25 percent in the end. Under Proposition 1(d) the buffer that keeps the chance of running out of cash at 1 percent is then 1.3 percent of exposure on the banks’ record and 3.2 percent in the middle case, and $5 billion supports about $390 billion and $150 billion. The stress case is unchanged, because there the ultimate loss per call (37 percent) exceeds a year’s debt service. A liquidity line from the AAA backer, drawn only to pay calls and repaid from recoveries, restores the solvency figures at little cost, since on the banks’ record almost all of what is called comes back.
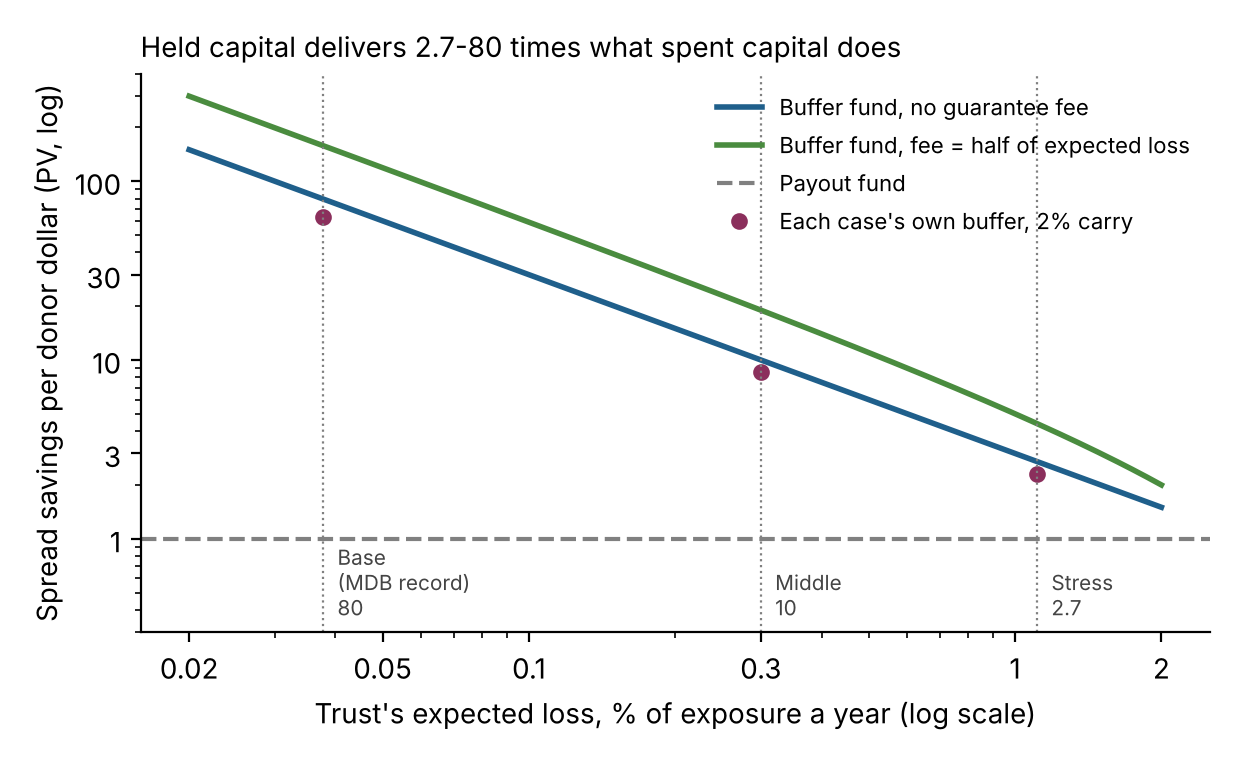
Each donor dollar held as a buffer delivers about 80 dollars of interest savings in the base case, 10 in the middle case and 2.7 in the stress case, when the buffer earns what donors would otherwise earn. From equation 2 with no fee and no carry, the incentive per donor dollar is \(0.03/0.00038 \approx 80\) on the banks’ record and \(0.03/0.0111 = 2.7\) in the stress case. In the stress case the $54 billion of exposure saves borrowers $1.6 billion a year at a 3-point spread; paid out in cash, $1.6 billion a year would use up $5 billion in about three years. A guarantee fee of half the expected loss raises the ratios to about 160, 19 and 4.4, because the borrower pays part of the cost and the capital lasts longer (Figure 2). The parameter that matters most is whether the government’s first-loss obligation to the Trust ranks like its obligations to development banks or like its market debt.
A carry, a horizon and prudence each cut the multiplier, and the third cuts it most. At a 2 percent carry the three ratios are 63, 8.6 and 2.3; at 0.5 percent, the running costs alone, they are 75, 9.6 and 2.6. Counting only interest savings to 2050, at no carry, they are 68, 9.5 and 2.6. The large cut comes from the policy the paper recommends. A Trust that holds the 9.25 percent stress-case buffer while its losses follow the banks’ record supports $54 billion, not $1 trillion, and consumes its capital at only 0.4 percent a year. At no carry it still delivers 80 dollars per dollar in the end, but over centuries: by 2050 it has delivered 7.7 dollars per dollar and still holds 90 percent of its capital. At a 2 percent carry the ratio is 13.5. Prudence costs about four-fifths of the incentive until the Trust’s own record lets it hold less, which is the case for building that record fast, with many small programs and published calls and recoveries.
2.Source/make_wp_figures.py.
6.3 Growth
A Trust levered to its base-case buffer must charge a guarantee fee to hold its capital steady: about 0.02 percent of exposure a year on the banks’ record, and 0.8 percent in the stress case. At the base leverage of about 200 times, expected losses consume \(0.00038/0.0049 = 7.7\) percent of capital a year, against 3.5 percent of net yield. From equation 4, the fee that stops the buffer shrinking is \(0.00038 - 0.0049 \times 0.035 = 0.02\) percent of exposure, 55 percent of the expected loss, and the borrower keeps almost all of the 3-point saving. In the stress case the fee is \(0.0111 - 0.0925 \times 0.035 = 0.79\) percent, 71 percent of the expected loss, and the borrower keeps 2.2 points. A Trust that charges no fee and has no other income shrinks by about 4 percent a year in the base case and 8.5 percent in the stress case. That is a legitimate choice, a subsidy that spends the capital slowly, but it is spending, not holding.
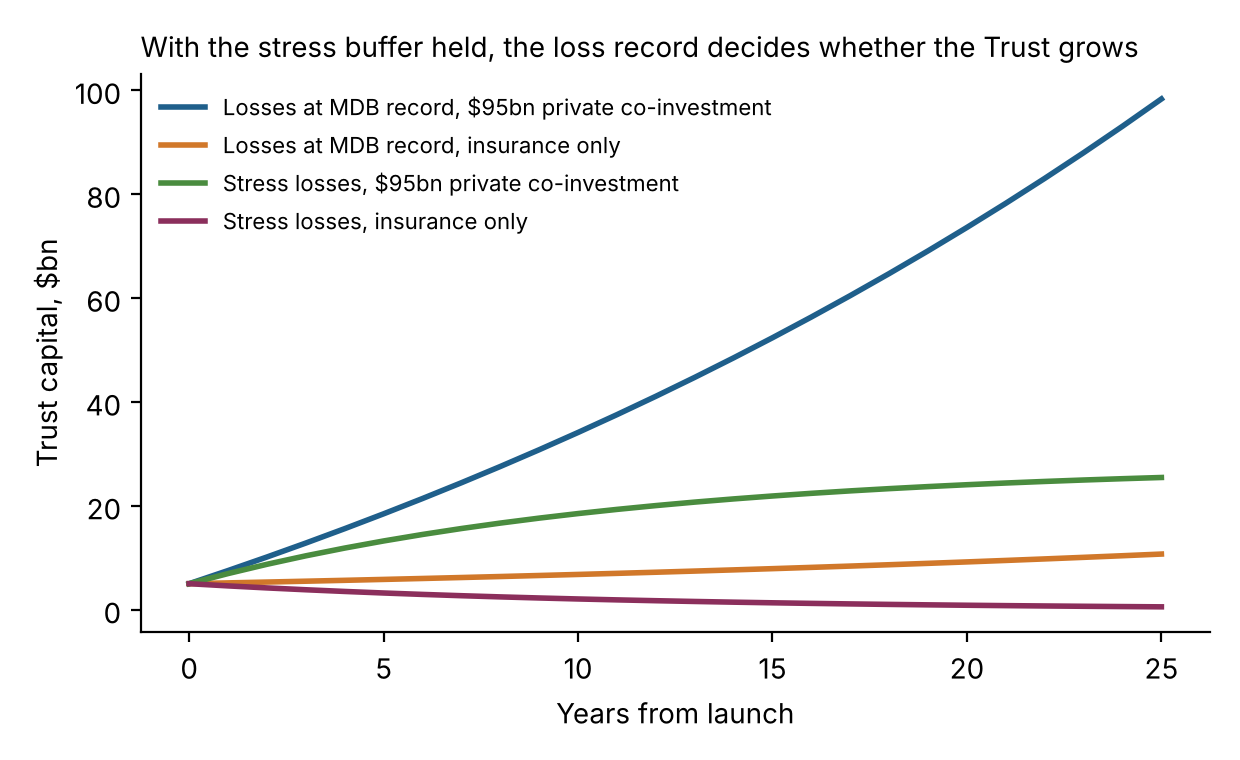
A Trust that holds the stress-case buffer grows on its own yield if its losses follow the banks’ record. With a 9.25 percent buffer and expected losses of 0.038 percent of exposure, losses consume 0.4 percent of capital a year against a net yield of 3.5 percent, so capital grows by 3.1 percent a year with no fee and no other income, to $10.7 billion after 25 years (Figure 3). The condition after equation 4 holds: the buffer’s net yield exceeds its expected losses. If losses are at the stress level, the same Trust shrinks by 8.5 percent a year without fee income. The self-funding question is therefore answered by the losses the Trust actually suffers, which it will observe within a few years.
Fee income on private co-investment makes the Trust grow faster, quickly at first and then more slowly. With $95 billion of private equity at a 10 percent gross return and a 25 percent fee, the Trust earns $2.4 billion a year. Holding the stress-case buffer with no guarantee fee, it grows by about half in its first year. If losses follow the banks’ record it reaches $34 billion after 10 years and $98 billion after 25, by which time it supports about $1.1 trillion of guarantees. If losses are at the stress level, the net burn rate is 8.5 percent, capital reaches $18.5 billion after 10 years and levels off near \(K^* = 2.4/0.085 \approx 28\) billion (equation 5). With only $10 billion of private co-investment the Trust reaches $9.7 billion after 10 years on the banks’ record and, in the stress case, falls toward $2.9 billion, below its launch capital.
2.Source/make_wp_figures.py.
Earlier versions computed growth at full leverage on the banks’ record, which implies more guarantees than developing countries have debt. At a 0.49 percent buffer and no guarantee fee, capital levels off near $57 billion; but at 200 times leverage that capital would stand behind about $11.5 trillion of guarantees, more than the $8.9 trillion combined external debt of all low- and middle-income countries in 2024 (World Bank 2025). Long before that, exposure is limited by demand, and a Trust whose capital outgrows its guarantee book is a Trust holding a thicker buffer than it needs, which grows. This paper therefore reports growth with the stress-case buffer.
The largest uncertainty is whether $95 billion of private equity will co-invest on these terms. It is 19 times the Trust’s launch capital and more than 100 times what Climate Investor One raised for development and construction equity (FMO 2019). A 7.5 percent net return is also low for construction-stage equity in developing countries, where the cost of capital for solar power is well over twice that in advanced economies (International Energy Agency 2024); under Proposition 2(c), investors who require more will not come, and the fee raises nothing. The calibration treats $95 billion as an upper case and $10 billion as a lower one. The growth result does not depend on the number, only on its sign: without fee income, a Trust that holds a thin buffer must charge most of its expected loss as a fee, and one that holds a thick buffer grows only if its losses are low.
The country stakes cost about $40 million a year to carry. At a 5 percent policy loan rate and a 4 percent buffer yield, the $4 billion of borrowed country stakes costs participants 1 point, or $40 million a year in total, $4 million for each of ten countries. The guarantees the Trust supports save them $1.6 billion a year at the base spread even with the stress-case buffer, and up to $30 billion on the banks’ record, so the condition after Proposition 2 holds by a wide margin in aggregate. It may fail for a country that borrows to contribute but receives little guarantee exposure, which argues for linking each country’s guarantee capacity to its stake as well as to its notional capitalized value.
6.4 One set of numbers
Earlier versions of the proposal used two sets of numbers, and this paper uses one. The May 2024 proposal and Time and Chance charge private investors about 25 percent of investment returns and assume a 10 percent return, so that $800 billion of equity across eight funds pays the Trust $20 billion a year; the same chapter also uses a 10 percent fee on a 15 percent return, $1.5 billion a year on $100 billion (Stretton 2024; Stretton 2026j, ch. 20). The two give similar fee income per dollar of private equity, 2.5 and 1.5 percent a year. This paper uses the 25 percent fee and 10 percent return throughout. Private investors then keep 7.5 percent, which is the hurdle the fee must respect under Proposition 2(c). The earlier claims that the Trust doubles “every two years” or “every three years” describe launch growth only.
The headline of $2 trillion a year of investment from eight funds is gross leveraged investment, not the Trust’s capacity, and is not carried forward. It assumes a global fund and seven regional funds of the same size, $800 billion of equity in total, debt of four times equity and a two-year construction cycle (Stretton 2026j, ch. 20). Each step is plausible, but together they require $760 billion of private equity on the Trust’s terms. The earlier list of regional funds also included North America, Europe and Central Asia, and China, which sits oddly with beneficiaries who are the future populations of participating developing countries. This paper restricts the regional funds to regions with participating developing countries.
Profit allocations cannot pay a full carbon price, and the calibration shows why the design does not depend on them. Earlier drafts sized the incentive at $100 per tonne on a 10 percent cut in about 10 billion tonnes a year, or about $100 billion (Stretton 2026j, ch. 20). That is about 40 times the Trust’s fee income in the upper case. The large rewards come elsewhere: from the guarantees the buffer supports, worth $1.6 billion a year to borrowers at launch with the stress-case buffer, more as the record allows a thinner buffer and as the Trust grows, and from the feebate between accounts, which costs nothing net.
6.5 The feebate between accounts
Account balances, not the Trust’s income, limit the strength of the feebate between accounts. In a stylized power sector of ten participating countries, each producing 200 terawatt-hours a year at intensities spread evenly from 0.3 to 0.9 tonnes of CO₂ per megawatt-hour, the benchmark is 0.6 and the most carbon-intensive country is 60 million tonnes above it. A feebate of $10 per tonne moves at most $0.6 billion a year to or from any one account and nets to zero. If a $5 billion Trust were divided equally among the ten accounts, a single year’s deduction could not exceed the balance at any rate above about $8 per tonne; this ignores the year’s base allocation, so it is the conservative version of Proposition 3(c). After 10 years of growth with the stress-case buffer and $95 billion of co-investment, the limit is about $31 per tonne in the stress case ($18.5 billion of capital) and $57 per tonne on the banks’ record ($34 billion).
Participation binds earlier, and how much earlier depends on the buffer the Trust holds. With a base allocation of $100 million a year per country and a carrying cost of $4 million, the most carbon-intensive country gains from joining at rates up to about $4 per tonne while the Trust holds the stress-case buffer, because $54 billion of guarantees saves each country only $162 million a year. Once its record allows the middle-case buffer the limit rises to about $12 per tonne, and on the banks’ record, with guarantee savings of up to $3 billion a year per country, to about $53 per tonne. That is why the transitional benchmark of Section 5.4 is needed until the Trust’s own record is known.
7 Regional funds and the equity layer
Every de-risking instrument makes debt cheaper, and all of them assume equity underneath that developing countries rarely have. Payment intermediaries, tiered guarantees and two-stage finance reduce the risk lenders bear (Stretton 2026f, 2026d). None creates the loss-absorbing capital that must sit beneath the lenders for the structure to be rated. Regional funds, set up by the Trust with regional development banks, supply it.
In portfolios of operating plants, the regional fund holds the first-loss tranche. Once plants are built and selling under guaranteed contracts, their senior debt can be pooled and refinanced through tranched securities: first-loss equity, a thin mezzanine and senior bonds. The regional fund holds the first-loss tranche. The same one-factor arithmetic as Proposition 1 sizes it, with project rather than sovereign default probabilities: in a large pool of operating plants, a cushion of 5 to 8 percent beneath the senior bond makes it near-AAA, while the first real securitizations of infrastructure loans carried about 30 percent (Stretton 2026e). The vocabulary differs from the policy guarantee case on purpose: for policy guarantees the government is first loss and the Trust second; for portfolios the regional fund is first loss and senior bondholders are protected by it.
The equity need is tens of billions of dollars, so the regional funds need private equity and recycling, not the buffer. Paper 3.2 puts the first-loss capital needed for a decade of solar investment in emerging and developing economies other than China at roughly $50–160 billion, recycled as pools are refinanced (Stretton 2026e). That is more than the Trust’s capital in any case calibrated here. The buffer must stay in high-grade bonds (Proposition 1(c)); the regional funds are capitalized by the Trust’s surplus, by regional development banks and by private co-investors on the limited terms of Section 4.
Construction-stage co-investment gives the fund the information to price first loss. A fund that has sat on the capital table of a hundred projects in a region before financial close knows how projects there fail: grid connection delays, developer insolvency, tariff disputes. That knowledge is what pricing first loss on their operating successors requires.
Diversification across a region is a resource the fund can sell. Project failures in different countries are imperfectly correlated, so the capital needed against a regional portfolio is less than the sum needed against its parts. The fund can act as cross-guarantor to portfolios it does not own and charge a fee, extending its effect beyond the projects it holds. The fee should be at least the expected loss on the cover sold, for the reasons in Proposition 2.
Regional funds can open a local-currency savings channel where there is no bond market. Senior tranches backed by the fund’s first-loss equity can be issued in local currency to domestic savers and pension schemes, giving a deposit-like green instrument with no currency mismatch (Stretton 2026d).
8 Design questions
Preferred creditor treatment decides which loss case the Trust is in, so it is the first design question. The banks’ record rests on an informal practice (G20 Expert Panel on Multilateral Development Banks’ Capital Adequacy Frameworks 2022). A Trust whose claims on governments are booked as claims of a development bank, under the bank’s guarantee and arrears policies, has the best chance of inheriting it; a free-standing fund that stands behind market debt is closer to the stress case. The recovery right matters as much as the default rate: the Trust should hold the government’s indemnity obligation directly, rank it with the government’s obligations to development banks, and publish every call and recovery so that its own record builds quickly.
Governance decides whether the Trust finances good policy. A fund that absorbs losses on politically visible assets will be asked, one plausible request at a time, to absorb losses it should not. Protections should be built in from the start, because rules written after the money arrives are written by those who want it. Allocation and deduction rules should be written before the first dollar arrives and changeable only by a super-majority of shareholders at the time of the change (Stretton 2026j, chs. 18 and 20). Every balance and every movement should be published. Trustees should be independent, with an endowment-style mandate. And the countries whose future populations are the beneficiaries should have a voice on the rules and a right to audit, but no vote on investments, which would bring back the political risk the structure exists to remove (Stretton 2026j, ch. 20). An alternative, in which participants vote on allocation rules weighted by their contribution in money or verified action, would let early movers set the rules; it is worth testing but raises questions of measurement and entry (Stretton 2026i, ch. 12).
The price of second loss decides whether the Trust crowds in or subsidizes. Proposition 2 makes the trade-off explicit. Every point of guarantee fee preserves capital and takes incentive back from the borrower; every point not charged is a subsidy that spends the buffer, unless the buffer is thick enough to earn its losses. The fee should be explicit, published and set by rule: for example, a fee equal to a fixed share of the modeled expected loss, with the share declining for countries that join early. For the regional funds’ first-loss tranches the same applies: a tranche priced below its risk transfers value to senior lenders who would have lent anyway.
The recycling rule decides whether investment capital is used once or many times. A fund that holds every construction-stage stake to maturity finances its portfolio once. A fund that sells seasoned operating assets into the secondary market, assets that are by then attractive to conventional investors, and reinvests in new construction recycles the same capital; with a two-year construction phase, each dollar finances a new project about every two years. Recycling needs a secondary market deep enough to absorb the sales, which the standard asset classes of paper 3.2 are designed to create (Stretton 2026d). The buffer is never recycled into projects.
Private capital should have limited voting rights and a fee that respects its hurdle. Private investors vote on the investment function only. Their fee, 25 percent of returns here, should be set so that their net return clears their required return (Proposition 2(c)); a fee above that bound raises nothing, because they do not come.
9 Policy implications
Donors and a multilateral development bank should launch the Trust as a buffer fund for policy guarantees, with capital in high-grade assets and a liquidity line from its AAA backer. The insurance-only Trust needs no pipeline of investments and no private partners. It needs donor capital, a manager, a AAA backer that accepts a second-loss buffer with a published exhaustion probability and lends it cash against recoveries, and a set of policy guarantees to stand behind. The natural first book is the guarantee capacity proposed in the companion paper: a country’s notional capitalized value sets the guarantees development banks will provide on its green borrowing, and the Trust’s buffer stands second loss behind them (Stretton 2026h).
The Trust should publish its allocation rule, its second-loss fee and its exhaustion target before it raises money, and hold the stress-case buffer until its own record is known. These numbers decide its effect. The allocation rule decides the incentive; the fee decides how fast the buffer is spent; the exhaustion target decides how much the AAA backer is exposed. Holding the stress-case buffer at launch costs incentive (about 13 dollars per donor dollar at a 2 percent carry, against 63 on the record), but if losses follow the banks’ record the Trust grows on its own yield and can release capacity as its record builds.
Countries should borrow to fund stakes only where the guarantees their stakes secure are worth more than the carrying cost. A country’s stake raises its gross debt. Its account is a real asset but is illiquid until 2050. The aggregate carrying cost of $40 million a year against $1.6 billion of interest savings with the stress-case buffer shows the trade is good on average. It is not good for every country, so guarantee capacity should rise with a country’s stake.
The Trust can be the reward channel for sustainability-linked sovereign lending. A margin step-down of up to 100 basis points on a few hundred million dollars, as in Uruguay’s 2023 World Bank loan, is small against the cost of the policies it is meant to induce. Delivering the reward instead as guarantee capacity or as a credit to the country’s beneficiary account, which it can pledge, multiplies its value by the ratio in Proposition 1 (Stretton 2026b).
The strongest objection is that the Trust is development bank capital under another name, and that donors would do better to recapitalize the banks. The two are complements, and the objection contains the Trust’s main risk. Bank capital increases are worth supporting, but they are constrained by shareholder politics and envelopes, and they are owed back to shareholders (G20 Expert Panel on Multilateral Development Banks’ Capital Adequacy Frameworks 2022). The Trust is additional capital, outside the banks’ balance sheets, that protects their guarantees without consuming their capital, and its gains accrue to the countries whose policies it rewards. Its weakness is the converse of the banks’ strength: outside a bank it may not be treated as a preferred creditor, which is why its claims should be booked through a bank and why the stress case is reported throughout.
The Trust costs donors its expected losses net of fees, its running costs and the return they forgo on capital held. On the banks’ record, donors’ $1 billion and countries’ $4 billion could support up to about $1 trillion of guarantees with expected losses of $0.4 billion a year before fees, or about $390 billion if the buffer must also pay calls in cash; in the stress case they support $54 billion, with expected losses of $0.6 billion a year. The Trust holds capital in safe assets that could have earned more elsewhere. Its guarantees create contingent liabilities for participating governments: smaller than the debt they replace, contingent on the governments’ own conduct and contracted, but liabilities all the same. Moral hazard is real, because a government that knows a buffer stands behind its commitments may honor them less carefully; first loss and recovery rights on the government’s obligation keep the incentive with the government.
The recommendation fails under four conditions. It fails if guarantee calls are far more correlated than assumed, as in a synchronized emerging-market debt crisis; at a correlation of 0.4 the base buffer rises from 0.5 to 0.7 percent of exposure and the stress buffer to 13 percent (Figure 1), and in the tail the AAA backer pays. It fails if the Trust does not inherit the development banks’ preferred creditor treatment and spreads are close to its expected losses; then \(s\) is near \(\lambda\) and the ratio in equation 2 approaches one. It fails if governance yields to pressure to cover losses it should not, which turns a buffer into a payout fund by another route. And its growth fails if losses are high and private co-investment does not come on terms that leave a fee, in which case the Trust holds steady only by charging most of its expected loss to borrowers.
10 Conclusion
A trust that holds donor capital behind policy guarantees delivers many times the incentive of the same money paid out, on a condition that can be checked: the spread saved must exceed the Trust’s expected loss, plus the carry on the capital it holds. This paper has shown how large the buffer must be for a given chance of exhaustion and for paying calls before recoveries, when the Trust grows without new donations, and how an allocation rule built as a feebate between accounts can reward performance and early action at no net cost. Its main limitation is the calibration: the base case borrows the development banks’ sovereign loss record, about 80 dollars of savings per donor dollar, but a new trust may not inherit their preferred creditor treatment, and in a stress case without it the figure is 2.7; while the Trust holds the stress-case buffer as a precaution, the figure is about 13 at a 2 percent carry. Correlations are stylized, because no such book yet exists. The next step is to test whether obligations to the Trust would be honored like obligations to the banks, using the record of development bank guarantees and sovereign arrears to development banks, and to work through the first application, the buffer behind guarantee capacity under a notional capitalized value, with a named country and real exposures.
Downloads
References
Appendix A: Proofs
Proposition 1(a). Conditional on \(Z = z\), the indicators \(\mathbf{1}\{X_i < \Phi^{-1}(p)\}\) are independent with probability \(q(z) = \Phi\big((\Phi^{-1}(p) - \sqrt{\rho}z)/\sqrt{1-\rho}\big)\). By the law of large numbers, \(\ell \to L\,q(Z)\) almost surely as \(n \to \infty\) (Vasicek 2002; Gordy 2003). Since \(q\) is decreasing in \(z\), \(P(L q(Z) > x) = P(Z < q^{-1}(x/L))\), and the \((1-\alpha)\) quantile of \(L q(Z)\) is \(L q(\Phi^{-1}(\alpha)) = L q(-\Phi^{-1}(1-\alpha))\), which is equation 1. It is increasing in \(p\) and \(L\) and decreasing in \(\alpha\) because \(\Phi\) and \(\Phi^{-1}\) are increasing. Writing \(h(\rho) = (\Phi^{-1}(p) + \sqrt{\rho}\,z_\alpha)/\sqrt{1-\rho}\) with \(z_\alpha = \Phi^{-1}(1-\alpha)\), \[ h'(\rho) = \frac{z_\alpha/\sqrt{\rho} + \Phi^{-1}(p)}{2(1-\rho)^{3/2}}, \] which is positive if and only if \(z_\alpha > \sqrt{\rho}\,|\Phi^{-1}(p)|\) when \(p < 1/2\). If \(\alpha \le p < 1/2\) then \(z_\alpha \ge |\Phi^{-1}(p)| > \sqrt{\rho}\,|\Phi^{-1}(p)|\) for every \(\rho < 1\). For finite \(n\) the quantile is computed by simulation. \(\square\)
Proposition 1(b). With exposure kept at \(G_t = K_t/b\), expected capital follows \(\dot K = (r_s - c)K - (\lambda - f)K/b\), so \(K_t = K_0 e^{-\gamma t}\) with \(\gamma = (\lambda - f)/b - (r_s - c)\). The incentive flow is \((s - f)G_t = (s-f)K_t/b\). Discounting at \(d = r_s - c + \kappa\), \[ \int_0^\infty \frac{(s-f)K_0}{b} e^{-(\gamma + d)t}\,dt = \frac{(s-f)K_0}{b(\gamma + d)} = \frac{(s-f)K_0}{\lambda - f + \kappa b}, \] since \(b(\gamma + d) = \lambda - f + \kappa b\). The integral diverges when the denominator is not positive. A payout fund that pays \(K_0\) out at once delivers present value \(K_0\). Hence equation 2; with \(\kappa = 0\), \(M > 1\) if and only if \(s > \lambda\). Because the incentive flow is linear in \(K\), the result holds for expected values when losses are random. Over a finite horizon \(T\) the incentive is \(\big((s-f)/b\big)(1 - e^{-(\gamma + d)T})/(\gamma + d)\) per dollar, and the capital left has present value \(e^{-(\gamma + d)T}\). \(\square\)
Proposition 1(c). If buffer assets worth \(K\) fall to \((1-k)K\) in the states in which losses reach the \((1-\alpha)\) quantile \(bG\), the buffer is sufficient only if \((1-k)K \ge bG\), so \(K/G \ge b/(1-k)\). \(\square\)
Proposition 1(d). With \(n\) equal programs the annual loss is \((L/n)D\), where \(D\) is the number of calls, so the buffer in part (a) is \((L/n)D_\alpha\), with \(D_\alpha\) the \((1-\alpha)\) quantile of \(D\). If each call requires cash \(m\,G/n\) before recovery, the cash needed in the year is \((m/n)D G\), and the buffer that covers both is \((\max(L, m)/n)D_\alpha\), which is \(\max(L,m)/L\) times the buffer in part (a). The same scaling holds in the limit, where \(D/n \to q(Z)\). \(\square\)
Proposition 2. equation 3 is linear: \(\dot K = -\beta K + \varphi r_e E_p + C\). (a) With \(E_p = C = 0\), \(\dot K / K = -\beta\), positive if and only if \(\beta < 0\), which rearranges to equation 4. (b) With \(C = 0\) and \(\beta > 0\) the solution is \(K_t = K^* + (K_0 - K^*)e^{-\beta t}\) with \(K^* = \varphi r_e E_p/\beta\); \(K_t\) moves monotonically toward \(K^*\), rising if \(K_0 < K^*\). The growth rate \(\dot K/K = \varphi r_e E_p/K - \beta\) falls as \(K\) rises, and exceeds \(g\) if and only if \(K < \varphi r_e E_p/(g+\beta)\). (c) Private investors receive \((1-\varphi)r_e\) and participate if it is at least \(r_p\), so \(\varphi \le 1 - r_p/r_e\) and fee income \(\varphi r_e E_p \le (r_e - r_p)E_p\). \(\square\)
Proposition 3. (a) \(\sum_i (\bar e - e_i)Y_i = \bar e \sum_i Y_i - \sum_i e_i Y_i = 0\) by the definition of \(\bar e\). (b) Holding output fixed, a one-tonne cut in emissions \(e_i Y_i\) lowers \(e_i\) by \(1/Y_i\) and \(\bar e\) by \(s_i/Y_i\). The feebate term changes by \(\tau\big((\bar e - s_i/Y_i) - (e_i - 1/Y_i)\big)Y_i - \tau(\bar e - e_i)Y_i = \tau(1 - s_i)\). With a leave-one-out benchmark \(\bar e_{-i}\), which does not depend on \(e_i\), the change is \(\tau\); the terms no longer sum exactly to zero because each country’s benchmark differs. (c) A deduction \(\tau(e_i - \bar e)Y_i\) can be enforced only against the balance and the year’s base allocation, giving the feasibility bound; participation requires the annual gain from joining to exceed the deduction. (d) A cut made at \(t\) rather than \(t+k\) earns \(\tau_{t+j}(1-s_i)\Delta Y_i\) in each of the \(k\) intervening years, discounted at \(\delta\); each term is positive. If \(\tau_t\) declines over time, a cut made at \(t\) earns the higher early rates, so the loss from delay exceeds that under a flat schedule at the later rates. \(\square\)
Appendix B: Calibration code
2.Source/model.py implements the one-factor buffer sizing by simulation (400,000 draws, fixed seed) and by equation 1, the incentive ratio of equation 2 with carry and over a finite horizon, the liquidity buffer of Proposition 1(d), the capital path of equation 3 in annual steps, the steady state of equation 5, and the allocation rule of equation 6 with the feasibility and participation bounds. Running python3 model.py prints every number in Section 6. 2.Source/make_wp_figures.py draws Figures 1–3, and 1.Presentation/figures/make_figures.py draws the brief’s figure from the same model.
Appendix C: Lineage and the facts settled
Name. The proposal was first written as the Climate Incentives Trust in May 2024, with an appendix sketching a companion Climate Investment Trust as an equity fund (Stretton 2024). Time and Chance calls related vehicles the Climate Investment and Insurance Fund (ch. 19) and the Climate Incentives Trust (ch. 20) (Stretton 2026j). This paper uses Climate Investment Trust for the single pool.
Fee rule and return. One set: 25 percent of private investment returns; 10 percent gross return on construction-stage equity (Section 6.4).
Loss positions. Policy guarantees: government first loss, Trust second loss, AAA entity behind, as in Time and Chance chs. 14 and 19. Project portfolios: regional fund holds the first-loss tranche, as in the series 3 asset classes (Stretton 2026d).
Country stakes. The $4 billion of developing-country co-investment is financed by long-term development policy lending, so it is borrowed; Section 5.3 states the carrying-cost condition.
Fiscal effect. Earlier text claimed the structure adds nothing to developing-country government liabilities. Time and Chance ch. 14 withdrew the claim; this paper says the exposure is a contingent liability, smaller than the debt it replaces, contingent on the government’s own conduct and contracted.
Growth. Version 0.2 of this paper reported long-run capital of about $57 billion ($28 billion in the stress case) at full leverage on the banks’ record; version 0.3 reports growth with the stress-case buffer held, for the reason in Section 6.3.
Role in the series. The first version of this paper described itself as a mechanism paper in the finance and risk series. It is now a flagship of the sovereign incentives series, paired with the notional capitalized value paper (Stretton 2026h).
Footnotes
The proposal was first written as the Climate Incentives Trust in May 2024 (Stretton 2024) and developed in the book manuscript Time and Chance (Stretton 2026j, chs. 14, 18–20). The regional fund design and the design questions draw on joint work on two-stage clean energy project finance with Jasper Zimmermann. Errors are the author’s own.↩︎