Guarantee the Contract, Not the Debt: A Payment Intermediary for Clean Power
Removing offtaker risk at source in developing-country power markets
Solar and wind plants are cheap to build in most developing countries but expensive to finance, because lenders and investors price the risk that a state-owned distribution company will not pay for the power. This paper proposes a payment intermediary facility: a national or regional institution that buys power from generators under one standard contract, pays them in full and on time whatever the distributor does, and recovers arrears itself, behind a guarantee waterfall agreed in advance. I model offtaker default as recurring episodes of withheld payment with delayed, partial recovery. In a stylized calibration the offtaker premium adds 11 percent to the solar tariff, or 1.4 percentage points to the cost of capital. Guaranteeing the contract removes all of it, saving about two dollars of tariff for each dollar of expected cost to the public guarantors behind the facility; guaranteeing project debt removes under a third of it and exposes the guarantor to the whole loan. Whether the saving is a real gain or a transfer of risk to the state depends on whether the facility collects better and makes default rarer. India’s Solar Energy Corporation shows that the design can work, and its distributors’ arrears show that it must be paired with utility reform.
cost of capital, offtaker risk, payment security, guarantees, single buyer, contingent liabilities
Working paper, version 0.3, October 2026. Stephen J. Stretton, writing in a personal capacity. The views expressed are the author’s own and do not represent those of any institution with which he is or has been affiliated. A short version for policy makers is Climate Fiscal Policy Brief No. 3.1.1
1 Executive summary
Policy brief (short version) → · Download this paper (pdf) · Slides (pdf)
Clean power in developing countries costs too much because its finance costs too much. A solar plant has no fuel bill, so the same stylized plant needs 3.9 US cents per kilowatt-hour if it is financed at a 5 percent real cost of capital and 6.5 cents at 12 percent. The International Energy Agency finds that the cost of capital for utility-scale solar in emerging and developing economies is well over twice that in advanced economies, and that financing can make up half or more of the cost of the power.
A large part of that premium is the risk that the buyer will not pay. The buyer, or offtaker, is usually a state-owned distribution company that sells below cost and collects poorly; in a World Bank study of 39 Sub-Saharan African countries, only two had a financially viable electricity sector. Lenders price the risk into every project that sells to such a company. In this paper’s model, a buyer that falls into a year of unpaid bills every six to seven years, and eventually pays back 60 percent of what it withheld, adds 11 percent to the tariff, the same as 1.4 percentage points on the cost of capital.
The proposal is a payment intermediary facility. It buys power from generators under one standard power purchase agreement, sells it on to the distribution companies, and pays generators in full and on time whatever the distribution companies do. Behind it stands a guarantee waterfall, agreed before the first plant is built: the distribution company, its state or provincial owner, the national government through an intercept of its transfers, a multilateral agency and a donor contingency account.
Guaranteeing the contract beats guaranteeing the debt. A contract guarantee removes the whole premium, because equity as well as debt is paid on time, and one guarantee covers every project selling to the same buyer. A debt guarantee protects only lenders. In the stylized 100-megawatt case the contract guarantee saves the buyer $0.94 million a year at an expected cost of $0.48 million to the guarantors behind the facility, about $2 of saving per dollar of cost. A debt guarantee on the same plant saves $0.30 million at an expected cost of $0.22 million for the same offtaker risk, and its worst case is the whole $60 million loan rather than a year of unpaid bills, $8.7 million.
The saving is real only if the facility makes default rarer or recovers more. With no price of risk and no better collection, the contract guarantee simply moves the expected loss from investors to the state. Its social value comes from three sources the design must earn: a repeat creditor with letters of credit and an intercept collects more (at 80 percent recovery the saving rises to $3.6 per dollar); a buyer facing one creditor and reform conditions defaults less often; and the state may bear the risk more cheaply than investors, except when the buyer’s default and the state’s fiscal stress come together.
India’s Solar Energy Corporation shows both halves of the argument. Rated AAA, it sells about 60 gigawatts at an average Rs 2.93 per kilowatt-hour, behind letters of credit, a payment security fund and the power to have the Reserve Bank of India debit a defaulting state’s account. But the distribution companies were never fixed: the central government organized a Rs 90,000 crore liquidity scheme in 2020 and let them reschedule Rs 1.4 lakh crore of arrears in 2022. Nigeria’s bulk trader, a single buyer that collected about a quarter of its bills and had no funded layer behind it, shows the failure.
What to do. Countries whose distribution companies buy most of the power should create or join a facility with one standard contract and a waterfall signed before the first tender: national facilities for large markets, regional ones for small states. Contract in local currency on tariffs that decline over time. Make entry conditional on utility reform, record the national guarantee at its expected cost under a published cap, and have development banks guarantee the facility rather than individual project loans. The state’s exposure becomes smaller, contingent and contracted; it does not disappear.
2 Introduction
Clean power in developing countries costs too much because its finance costs too much. A solar plant has no fuel bill, so the price of its electricity is mostly the repayment of the capital that built it. A stylized plant that needs 3.9 US cents per kilowatt-hour when financed at a 5 percent real cost of capital needs 6.5 cents at 12 percent. The International Energy Agency’s survey of financiers finds that the cost of capital for utility-scale solar in emerging and developing economies is “well over twice” that in advanced economies, and that financing can be around half or more of the levelized cost of electricity there; it estimates that narrowing the gap by one percentage point would cut clean energy financing costs in these economies by about $150 billion a year (International Energy Agency 2024).
A large part of the premium is the risk that the buyer of the power will not pay. In most developing countries that buyer, the offtaker, is a state-owned distribution company that sells below cost and collects poorly. Of 39 Sub-Saharan African countries studied by the World Bank, only Seychelles and Uganda had a financially viable electricity sector, and only 19 covered their operating costs (Trimble et al. 2016). In India, the power sector’s losses in 2011, concentrated in distribution, were about 0.7 percent of GDP (Pargal and Banerjee 2014). When such a utility runs short of cash, its generators wait. The IEA’s survey ranks payment risk among the top three sector-specific risks that investors price in these economies, and puts project- and sector-specific elements, led by the offtaker’s ability to pay on time, at 20–30 percent of the higher cost of capital (International Energy Agency 2024).
This paper asks how a developing country can remove the payment risk that sets the cost of capital for clean power, at the lowest contingent cost to the state.
The answer is to put a creditworthy intermediary between generators and distribution companies. A payment intermediary facility buys power from generators under one standard power purchase agreement, on-sells it to distribution companies, and pays generators in full and on time whatever the distribution companies do. It recovers arrears itself, and behind it stands a guarantee waterfall, contracted in advance: the offtaker, its subnational owner, the national government, a multilateral agency and a donor contingency account. Guaranteeing the contract beats guaranteeing project debt. It removes the whole offtaker premium, covers every project that sells to the same buyer, keeps the claim on the distribution company alive and caps the guarantor’s exposure at the arrears of an episode rather than the face value of a loan. Whether it creates value, rather than moving risk to the state, depends on whether the facility collects better and makes default rarer. India’s Solar Energy Corporation shows that the design can lower tariffs; its distribution companies’ arrears show that it fails without utility reform.
The idea is not new in practice, and the paper’s contribution is to give it a model. The IEA recommends using “third-party creditworthy institutions such as Solar Energy Corporation of India (SECI) to manage off-taker risk” and extending guarantees that cover payment delays (International Energy Agency 2024). The World Bank Group’s Scaling Solar program backed a Zambian utility’s letters of credit with an IDA payment guarantee (World Bank Group 2018), and the African Trade Insurance Agency’s liquidity facility covers independent power producers for up to six months of delayed payment (Wass 2017). The paper makes four contributions to this practice. First, it gives a tractable model of offtaker risk as recurring episodes of withheld payment with delayed, partial recovery, and derives the offtaker premium in the tariff (Proposition 1). The premium depends on how long arrears last and how much is recovered, which are what an intermediary changes. Second, it states the conditions under which a contract guarantee dominates a debt guarantee in coverage, in expected cost per unit of tariff reduction and in maximum exposure, and it separates the part of the gain that is a transfer of risk to the state from the part that is a real saving (Proposition 2). Third, it derives the expected calls on each layer of the waterfall and the liquidity buffer that makes the facility insolvency-remote under correlated offtaker defaults (Proposition 3). Fourth, it applies the results to public facts on India’s Solar Energy Corporation and Nigeria’s bulk electricity trader, and turns them into design rules on tariff profiles, currency, national versus regional facilities, countries in debt distress, utility reform and fiscal accounting. Relative to the de-risking literature, which classifies public instruments and estimates their effect on the cost of capital (Waissbein et al. 2013; Schmidt 2014), the paper models a specific institution and compares two forms of guarantee. Relative to the literature on government guarantees (Irwin 2007; Polackova 1998), it shows how one form of guarantee converts an implicit fiscal risk into a smaller, explicit and contracted one, and when it does not.
3 Related literature
The cost of capital decides the cost of renewables. Because wind and solar are capital-intensive, their levelized cost is highly sensitive to the cost of capital. Data on 133 utility-scale solar and onshore wind projects in Germany show that financing conditions improved strongly over 18 years, driven by lower interest rates and by experience in the renewable finance industry (Egli et al. 2018). Evidence from 46 countries shows that the cost of capital for renewable projects is significantly higher on average in developing countries, with wide variation within each group (Steffen 2020). Higher finance costs make low-carbon investment in developing economies dearer relative to fossil investment and can trap them in a “climate investment trap” (Ameli et al. 2021). In an ensemble of five climate-energy-economy models, letting developing-country costs of capital converge toward those of developed countries brings more renewable and more affordable energy (Calcaterra et al. 2024). The IEA’s survey for the G20 confirms the gap and names offtaker payment risk as one of its parts (International Energy Agency 2024).
De-risking. A second literature asks how public instruments can lower these costs. The UN Development Programme’s framework classifies each public instrument by whether it reduces a risk, transfers it to a public actor or compensates investors for bearing it, and estimates the effect on financing costs and the levelized cost (Waissbein et al. 2013). Schmidt (2014) argues that policy makers can raise the cost-effectiveness of climate policy in developing countries by reducing investors’ risks rather than paying for them. The payment intermediary sits across the first two categories. It transfers payment risk to a public institution, but because that institution is a repeat creditor with collection powers, it can also reduce the risk; Proposition 2 says how much of its gain depends on that.
Single buyers and payment security. The intermediary is a single buyer for the power it contracts, and single buyers have a bad record. A World Bank Viewpoint argued that the single-buyer model in developing countries invites corruption, weakens payment discipline and imposes contingent liabilities on the government (Lovei 2000). A later World Bank review found that a pure single buyer is sometimes the only workable option, especially in distressed power systems, but that a legal monopoly for it is neither necessary nor desirable (Arizu et al. 2006). Practice has since moved to narrower payment-security instruments: letters of credit backed by multilateral payment guarantees, as under Scaling Solar in Zambia (World Bank Group 2018); regional liquidity facilities that fund standby letters of credit, as the African Trade Insurance Agency’s (Wass 2017); and payment guarantees for single buyers, as for Nigeria’s bulk trader (World Bank Group 2024). Section 9 answers the single-buyer critique.
Government guarantees and contingent liabilities. Guarantees are options: a loan guarantee is a put on the borrower’s assets with a strike equal to the debt (Merton 1977), and its cost to a government is the expected value of the calls it will meet, which governments often fail to budget (Irwin 2007). Polackova (1998) classifies government liabilities as direct or contingent, explicit or implicit; bailouts of state utilities are the textbook implicit contingent liability. Statistical standards record provisions for expected calls under standardized guarantee schemes as liabilities and treat one-off guarantees as contingent (International Monetary Fund 2014). This paper uses these tools to compare the two forms of guarantee and to say how the facility’s exposure should be recorded.
Credit risk. The model of offtaker default borrows from reduced-form credit models, in which defaults arrive at a random intensity and the value of a risky claim is found by discounting at a rate that adds the intensity times the loss on default (Duffie and Singleton 1999). Default risk is priced above its actuarial cost: corporate bond prices embed significant premia on common default-intensity factors, and a positive, if imprecisely estimated, premium on the default event itself (Driessen 2005). For a portfolio of correlated offtakers, the one-factor model of Vasicek (2002) gives the distribution of losses.
The gap. The literature establishes that the cost of capital matters, that de-risking lowers it and that payment guarantees work in practice, but it has not compared contract guarantees with debt guarantees formally, separated the transfer in a guarantee from its real gain, or modeled an intermediary with a layered waterfall and its fiscal cost. Earlier versions of this argument asserted the advantages of guaranteeing the offtaker rather than the loan (Stretton 2026e). This paper supplies the model, the conditions and a calibration.
4 A model of offtaker risk and its guarantee
4.1 The cost of capital sets the tariff
A solar plant costs \(I\) per kilowatt up front, costs \(F\) per kilowatt a year to run, and produces \(E\) kilowatt-hours per kilowatt a year for \(T\) years. At a real weighted average cost of capital (WACC) \(r\), its levelized cost is \[ \mathrm{LCOE}(r) = \frac{I\,a(r) + F}{E}, \qquad a(r) = \frac{r}{1 - (1+r)^{-T}}, \tag{1}\] where \(a(r)\) is the capital recovery factor. Since \(F\) is small, the tariff rises almost in proportion to \(a(r)\). The plant is the stylized plant used throughout this series: \(I = \$800\), a 20 percent capacity factor (\(E = 1{,}752\)), \(F = \$12\) and \(T = 25\), with capital spent at commissioning. Paper 3.2 adds interest during a two-year construction period (Stretton 2026c).
4.3 Guarantee the contract or guarantee the debt
A public guarantor can cover the generator’s contract or the project’s debt. Under a contract guarantee the facility pays the generator the contracted amount during every episode and recovers from the offtaker itself a fraction \(R_F\) of what it paid, at the end of the episode. What it does not recover passes to the layers of the waterfall (Section 4.4), so the expected cost of the guarantee is borne by the facility and its guarantors together. Under a debt guarantee the guarantor pays the project’s lenders when the project fails to service its debt, from any cause, and recovers a fraction \(R_D\) by subrogation against the project company, \(D_D\) years later. Let \(g\) be the share of capital financed by debt.
The two guarantees remove different parts of the risk. A contract guarantee removes the whole haircut \(h\), because the generator is paid in full. A debt guarantee removes only the part that would fall on lenders. Write that part as \(\theta h\), with \(0 \le \theta \le 1\). When the equity cushion and debt service reserve absorb every episode, \(\theta = 0\): the lenders were never at risk, and the guarantee removes nothing from the tariff. \(\theta\) rises with leverage and with the length of episodes. A debt guarantee also covers non-payment from other causes, such as construction failure or plant breakdown, whose expected cost to the guarantor I write as \(\psi \ge 0\) per unit of contracted payments. The model holds \(r_0\) fixed and so does not credit the tariff reduction that cover of those other risks may bring; the comparison below is therefore made on the offtaker risk alone.
Let the facility’s recovery value be \(\tilde R_F = R_F\,\frac{1 - e^{-r_0 D}}{r_0 D}\), on the same footing as the generator’s \(\tilde R\), and the debt guarantor’s be \(\tilde R_D = R_D\,e^{-r_0 D_D}\).
Proposition 2 (contract versus debt guarantee). Under the assumptions of Proposition 1:
(i) Coverage. The tariff under a contract guarantee is \(P_C = \mathrm{LCOE}(r_0)\); under a debt guarantee it is \(P_D = \mathrm{LCOE}(r_0)/(1 - (1-\theta)h) \ge P_C\), with equality only if all offtaker losses fall on lenders (\(\theta = 1\)). One contract guarantee covers every project selling to the guaranteed offtaker.
(ii) Expected cost. Per unit of contracted payments, the expected annual cost of the contract guarantee to the facility and its guarantors together is \(c_C = \varphi(\lambda)(1 - \tilde R_F)\), and their exposure in any one episode is bounded by the arrears \(AD\). The debt guarantor’s expected cost is \(c_D = \theta\varphi(\lambda)(1 - \tilde R_D) + \psi\), and its exposure is bounded only by the outstanding debt.
(iii) Efficiency. The offtaker loss removed per unit of expected cost is \[ \frac{h}{c_C} = \frac{\varphi(m\lambda)}{\varphi(\lambda)}\cdot\frac{1 - \tilde R}{1 - \tilde R_F} \qquad\text{and}\qquad \frac{\theta h}{\theta\varphi(\lambda)(1 - \tilde R_D)} = \frac{\varphi(m\lambda)}{\varphi(\lambda)}\cdot\frac{1 - \tilde R}{1 - \tilde R_D} \tag{6}\] for the contract and, on the offtaker risk alone, the debt guarantee. The contract guarantee is at least as efficient whenever \(\tilde R_F \ge \tilde R_D\), that is, whenever the facility recovers at least as much from the offtaker, in present value, as a debt guarantor recovers from the project company. It removes at least its expected cost whenever \(m \ge 1\) and \(\tilde R_F \ge \tilde R\), with equality when \(m = 1\) and \(\tilde R_F = \tilde R\).
The conditions are the substance of the result. The recovery condition \(\tilde R_F \ge \tilde R_D\) holds whenever the facility keeps a claim on the offtaker and the debt guarantor’s claim runs against a project company whose only asset is an unpaid contract, recovered later. It fails if the facility cannot enforce its claim, which is why the waterfall and the intercept matter.
The equality case in (iii) separates transfer from gain. When investors charge no premium for default risk (\(m = 1\)) and the facility collects no better than generators would (\(\tilde R_F = \tilde R\)), the contract guarantee removes exactly its expected cost: it moves the expected loss from investors to the facility’s guarantors and creates nothing. Everything above that comes from three sources, which have different welfare meanings. Better recovery, the factor \((1-\tilde R)/(1-\tilde R_F)\), is a real resource gain: a repeat creditor with letters of credit and an intercept collects more than dispersed generators. Fewer episodes, a lower \(\lambda\) because the offtaker faces one creditor and reform conditions, is also real; in equation 6 it lowers \(c_C\) and \(h\) together, and its benefit appears as a lower tariff. The price of risk, the factor \(\varphi(m\lambda)/\varphi(\lambda)\), is a gain to society only if the state is better placed to bear the risk than investors are. It is not when the offtaker’s default is correlated with the state’s own fiscal distress, as it often is, and Section 8 returns to that point.
A debt guarantee is not always worse. Where there is no contract to guarantee, as for transmission lines or factories, a guarantee on the bond is the only option, and the series treats it in Paper 3.2 (Stretton 2026b). Where the offtaker is sound and the main risk is construction, a guarantee targeted on construction finance is better than either. The proposition says that where offtaker payment is the binding risk, the guarantee should attach to the payment.
4.4 The facility under a guarantee waterfall
The facility holds a portfolio of contracts with \(M\) offtakers, paying \(A\) a year in total. Behind the offtakers stand layers \(k = 1, \dots, K\): the subnational owner, the national government, a multilateral agency and a donor contingency account. When an episode leaves arrears unrecovered from the offtaker, the shortfall passes down the layers in order; layer \(k\) pays in full with probability \(q_k\), independently of the layers above it, and otherwise passes the shortfall on. The facility holds a liquidity buffer \(B\) to pay generators while it waits for a layer to provide funds, which takes up to \(H\) years. Episodes across offtakers are correlated through a common factor: each offtaker enters an episode within a year with probability \(p = 1 - e^{-\lambda}\), and the latent variables driving episodes have pairwise correlation \(\rho\).
Proposition 3 (expected calls and insolvency remoteness). (i) The expected annual call on layer \(k\) is \[ C_k = \varphi(\lambda)\,A\,(1 - \tilde R_F)\; q_k \prod_{j<k}(1 - q_j), \tag{7}\] and the facility’s own expected loss is \(\varphi(\lambda)A(1 - \tilde R_F)\prod_{k=1}^{K}(1 - q_k)\), which is zero if the last layer is funded and certain (\(q_K = 1\)). The calls sum to the expected cost \(c_C A\) of Proposition 2.
(ii) In a large portfolio, the facility can pay generators in full at confidence \(1 - \varepsilon\) if \[ B \ \ge\ A\,H\,\Phi\!\left(\frac{\Phi^{-1}(p) + \sqrt{\rho}\,\Phi^{-1}(1-\varepsilon)}{\sqrt{1-\rho}}\right) \tag{8}\] and the last layer’s committed capacity covers the shortfall that reaches it at the same confidence. Under these conditions the facility is insolvency-remote: every loss is borne by a contracted layer, never by generators.
Part (i) shows where the cost of the guarantee falls. Each layer’s expected cost depends on the reliability of the layers above it, so a reliable intercept by the national government (\(q_2\) near one) makes the multilateral and donor layers cheap. The independence assumption flatters the upper layers: a state government whose utility has defaulted is itself likely to be short of cash, so in practice the \(q_k\) fall together in a crisis and expected calls shift down the waterfall toward the national, multilateral and donor layers. Part (ii) is the standard large-portfolio result (Vasicek 2002) applied to arrears rather than losses. It treats the share of offtakers entering an episode in a stressed year as the share in arrears at once, an approximation that is close when episodes last about a year. It is about bridging, not final cost: the buffer pays generators until a layer provides liquidity, while part (i) gives who finally pays. It shows why diversification has limits: when offtaker defaults are driven by a common shock, such as a devaluation or a fuel price spike, the buffer must be sized for the share of offtakers in arrears at the same time, not for the average. The calls \(C_k\) are expected payments, not final losses. A national government that pays a utility’s arrears acquires a claim on its own utility; whether it collects is a question of utility reform, not of the facility’s design.
5 Calibration
5.1 The plant and the price of capital
The stylized 100-megawatt plant costs $80 million and produces 175,200 megawatt-hours a year. Table 1 and Figure 1 show its levelized cost at real WACCs from 4 to 15 percent. Moving from 12 percent to 5 percent cuts the tariff from 6.5 to 3.9 cents per kilowatt-hour, and the annual revenue the plant needs from $11.4 million to $6.9 million. At 8 percent each percentage point of WACC is worth 0.37 cents per kilowatt-hour, about 7 percent of the tariff. The return on capital, the part of the tariff above straight-line depreciation and operating costs, rises from 30 percent of the tariff at 4 percent to 61 percent at 12 percent, comparable to the IEA’s finding that financing can be half or more of the cost of solar in emerging and developing economies (International Energy Agency 2024).
2.Source/model.py.
| WACC (real) | 4% | 5% | 6% | 8% | 10% | 12% | 15% |
|---|---|---|---|---|---|---|---|
| Levelized cost (US cents/kWh) | 3.61 | 3.92 | 4.26 | 4.96 | 5.72 | 6.51 | 7.75 |
| Relative to 4% | 1.00 | 1.09 | 1.18 | 1.38 | 1.58 | 1.80 | 2.15 |
| Return on capital, share of cost | 30% | 36% | 41% | 49% | 56% | 61% | 68% |
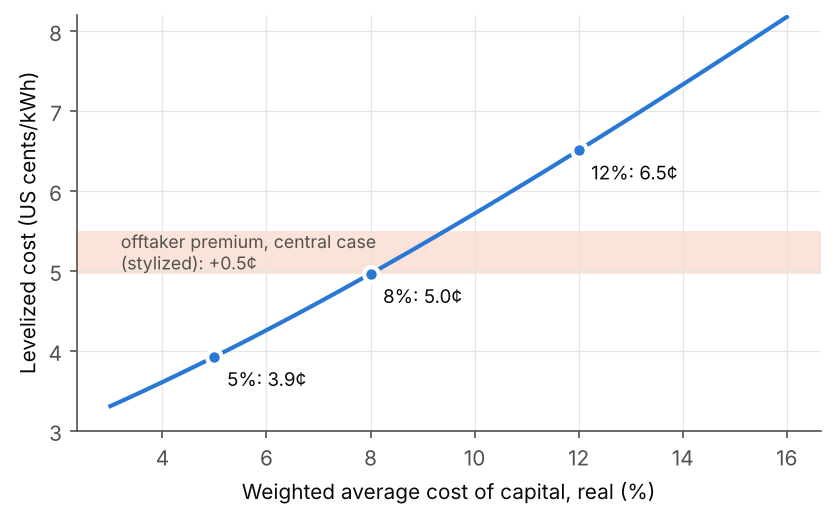
2.Source/make_wp_figures.py.
5.2 How much the offtaker costs
The central case assumes a WACC of 8 percent for every risk except the offtaker’s, one default episode every six to seven years (\(\lambda = 0.15\)), episodes lasting a year (\(D = 1\)), recovery of 60 percent of withheld payments (\(R = 0.6\)), and a price of risk \(m = 2\). All five are stylized. They describe a weak but not failed utility, one that is regularly late and eventually pays most of what it owes. The value of \(m\) reflects the finding that default risk carries a premium in bond prices (Driessen 2005); I do not claim a point estimate, and report \(m = 1\) alongside.
In the central case the offtaker is in arrears 23 percent of the time at the risk-neutral intensity, a withheld dollar is worth 58 cents in present value, and the haircut \(h\) is 9.8 percent. The break-even tariff rises from 4.96 to 5.50 cents per kilowatt-hour, an offtaker premium of 0.54 cents or 10.8 percent, equivalent to a WACC of 9.4 percent instead of 8. Table 2 and Figure 2 show how the premium varies. A utility with 25 episodes per 100 years that pays back only 30 percent of what it withholds adds 4 percentage points to the WACC; one that is late as often but pays back 90 percent adds 0.6 points. Episodes of six months halve the central-case premium, and episodes of two years nearly double it. Without a price of risk (\(m = 1\)) the premium falls to 5.8 percent of the tariff.
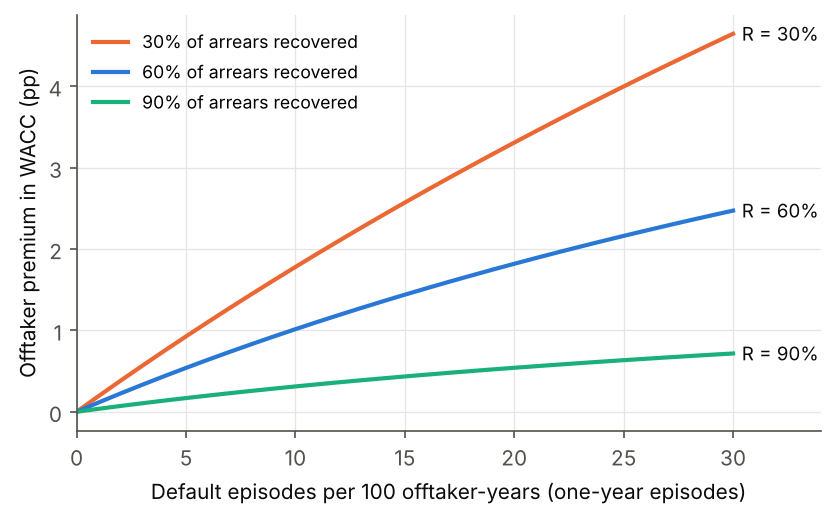
2.Source/make_wp_figures.py.
These magnitudes are plausible against observed gaps. The IEA puts project- and sector-specific risks, led by the offtaker’s ability to pay on time, at 20–30 percent of the cost of capital of power projects in emerging and developing economies (International Energy Agency 2024): on a WACC of 10 percent, 2–3 points, of which the offtaker is one part alongside regulation and grid access. The central case attributes 1.4 points to the offtaker. I treat this as an illustration of mechanism, not an estimate.
5.3 Contract versus debt guarantee in numbers
Table 3 applies Proposition 2 to the 100-megawatt plant. In the central case the facility recovers from the offtaker no more than a generator would (\(R_F = R = 60\) percent, at the end of the episode); the rest falls on the waterfall. The debt guarantor recovers 50 percent from the project company, three years later. Debt is 75 percent of capital, so the plant borrows $60 million. Lenders bear 30 percent of the offtaker’s losses (\(\theta = 0.3\)), and the debt guarantee also covers other risks with an expected cost of 1 percent a year of a 30 percent loss on the debt. All of these are stylized.
2.Source/model.py.
| Stylized 100 MW solar plant | No guarantee | Contract guarantee | Debt guarantee |
|---|---|---|---|
| Tariff (US cents/kWh) | 5.50 | 4.96 | 5.33 |
| Saving to the offtaker ($ million/year) | – | 0.94 | 0.30 |
| Expected cost of the offtaker risk to guarantors ($ million/year) | – | 0.48 | 0.22 |
| Saving per dollar of that cost | – | 2.0 | 1.4 |
| Expected cost of other risks covered ($ million/year) | – | 0 | 0.18 |
| Maximum exposure ($ million) | – | 8.7 per year of arrears | 60 of debt at close |
The contract guarantee cuts the tariff by 0.54 cents, the whole offtaker premium, and saves the offtaker $0.94 million a year; the expected cost to the facility and the layers behind it is $0.48 million, 5.5 percent of the plant’s contract payments. The debt guarantee cuts the tariff by 0.17 cents, under a third of the premium, at an expected cost of $0.22 million for the offtaker risk. Per dollar of expected cost on the same risk, the contract guarantee saves $2.0 and the debt guarantee $1.4 (Figure 3). The difference comes from recovery: the facility keeps 58 cents of each dollar of arrears in present value, the debt guarantor 39. If the debt guarantor is also charged for the construction and operating risks it covers, $0.18 million a year, its ratio falls to 0.75, but the model does not credit the lower cost of capital that removing those risks could bring, so the fair comparison is on the offtaker risk.
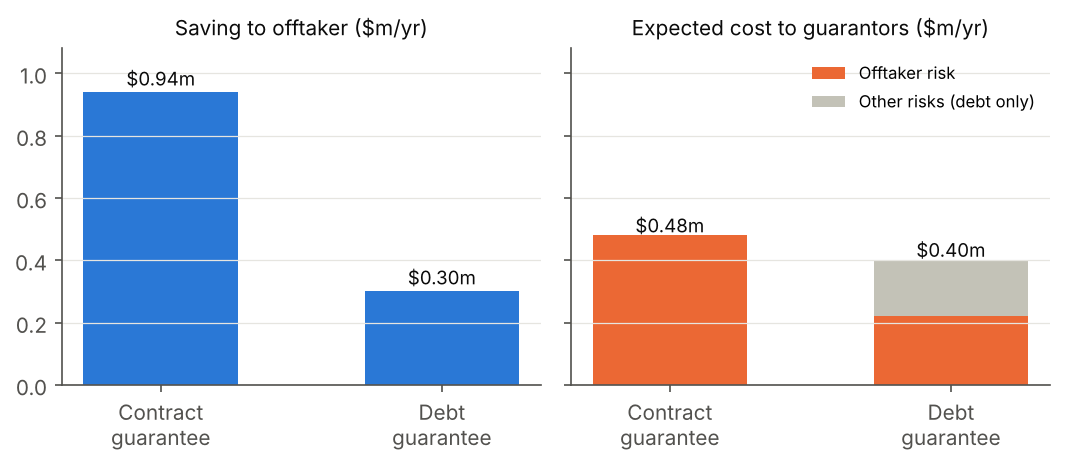
2.Source/make_wp_figures.py.
The decomposition in Proposition 2(iii) shows where the contract guarantee’s $2.0 comes from. The price-of-risk factor is \(\varphi(0.30)/\varphi(0.15) = 1.77\) and, in the central case, the recovery factor is 1. All of the gain is therefore investors’ price of risk, which the state takes on at its actuarial cost. With \(m = 1\), the guarantee saves the offtaker $0.51 million at an expected cost of $0.48 million: a near-pure transfer. If the facility recovers 80 percent rather than 60, the recovery factor rises to 1.83 and the saving to $3.6 per dollar, and that part is a real resource gain. The case for the facility therefore rests on its collection: on letters of credit, the intercept and a single creditor’s leverage. India’s record in Section 6.1 is the test.
The exposures differ by an order of magnitude. The guarantors’ worst case in one episode is a year of unpaid bills, $8.7 million, much of which they recover. The debt guarantor’s worst case is the loan, $60 million at financial close. That difference is the difference between a guarantee priced at expected loss with a cap and one that must be capitalized at face value.
5.4 A regional facility under its waterfall
Consider a regional facility that buys the output of 2 gigawatts of solar plants from ten offtakers, under the central-case parameters, with contract payments of $174 million a year. The facility expects to fund $22.7 million of arrears a year, of which 42 percent in present value is not recovered from the offtakers themselves. Table 4 and Figure 4 show where that shortfall goes, with stylized probabilities that each layer pays: the subnational owner 0.5, the national government 0.8, a multilateral agency 0.9 and a funded donor account 1. The calls add up to 5.5 percent of contract payments, the same share as the contract guarantee’s expected cost in Table 3, because both use the same recovery from the offtaker.
2.Source/model.py.
| Layer | Probability it pays when called | Expected call ($ million/year) | Share of contract payments |
|---|---|---|---|
| Subnational owner | 0.5 | 4.80 | 2.76% |
| National government | 0.8 | 3.84 | 2.21% |
| Multilateral agency | 0.9 | 0.86 | 0.50% |
| Donor contingency account | 1.0 | 0.10 | 0.06% |
| Facility (residual) | – | 0 | 0 |
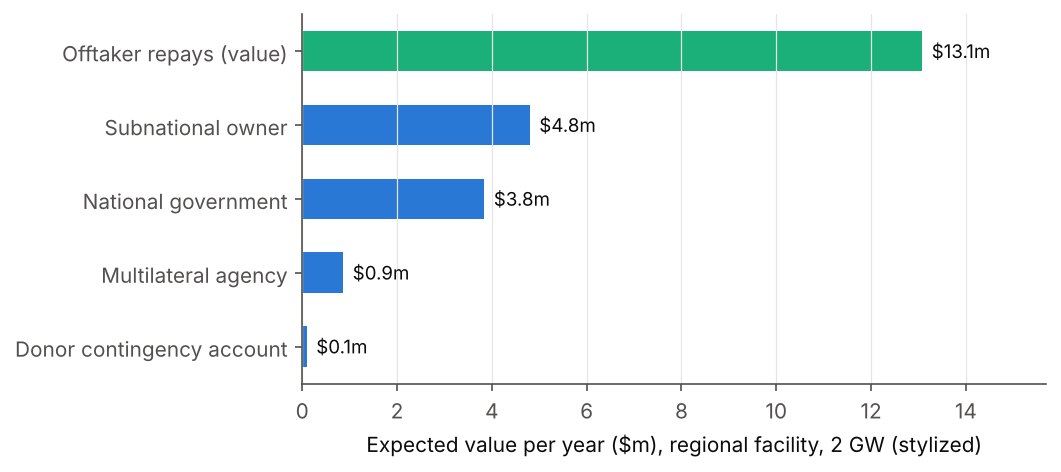
2.Source/make_wp_figures.py.
Three results follow. The donor account at the bottom is cheap, $0.1 million a year, because the national layer is reliable; if the national government’s intercept worked only half the time, the donor’s expected cost would rise two and a half times. The facility’s own expected loss is zero with the donor account and 0.06 percent of payments without it, well within a trading margin like India’s. And the expected calls on the subnational and national layers, about 5 percent of payments, are the price of the offtakers’ unreliability, paid by their owners rather than by consumers through a risk premium on every project.
Liquidity, not loss, is what can break the facility. Each offtaker enters an episode in a given year with probability 13.9 percent. If episodes are driven by a common factor with correlation 0.3, the share of offtakers in arrears in a 1-in-200 year is 65 percent. A facility that must wait six months for the national layer then needs a buffer of $57 million, a third of a year’s payments or about $28,000 per megawatt (equation 8). With correlation 0.1 the stress share falls to 39 percent; with 0.5 it rises to 85 percent. For comparison, India’s Solar Energy Corporation asks developers in newer tenders to deposit Rs 5 lakh per megawatt toward its payment security fund (ICRA 2025), about $6,000 at roughly Rs 85 per dollar; it relies on letters of credit and the intercept for the rest. The African Trade Insurance Agency’s facility covers six months of an independent producer’s operation and debt service (Wass 2017), the same order as the six-month bridge assumed here.
5.5 India in the model
The Solar Energy Corporation of India earns a trading margin of Rs 0.07 per kilowatt-hour on a weighted average sale tariff of Rs 2.93 (ICRA 2025), or 2.4 percent of the tariff. In the model the margin pays for itself if the intermediary lowers the WACC by 0.32 percentage points, under a quarter of the central-case offtaker premium. Applied to the corporation’s roughly 60 gigawatts of sale agreements, at the stylized plant’s capacity factor, the central-case premium would cost about Rs 3,300 crore a year, against a margin of about Rs 740 crore. These numbers are illustrative: wind contracts have different capacity factors, and the counterfactual premium for Indian state distribution companies is not observed. The IEA reports that the cost of capital for utility-scale solar in India is about 50 percent higher than in the European Union and names non-payment by state-owned distribution companies as a key driver (International Energy Agency 2024). A direct comparison of tariffs in the corporation’s auctions with those in auctions run by state distribution companies on their own credit would test Proposition 1. I have not found public data clean enough to do it here.
6 Precedents and failures
6.1 India’s Solar Energy Corporation: the waterfall works, the buyers were not fixed
The Solar Energy Corporation of India is the clearest working example of a payment intermediary facility. It is wholly owned by the central government. It signs power purchase agreements with developers only after it has signed back-to-back power sale agreements with state distribution companies on similar terms, so it carries no demand risk. In July 2025 it had sale agreements for about 60 gigawatts at a weighted average tariff of Rs 2.93 per kilowatt-hour, which the rating agency ICRA describes as well below the distribution companies’ average power purchase cost (ICRA 2025).
Its payment security is layered, much as Section 4.4 proposes. Each layer can be checked against public sources:
- Letters of credit. Distribution companies must open letters of credit for the corporation, which earns its Rs 0.07 margin subject to their opening (ICRA 2025). A Ministry of Power order of 28 June 2019, effective 1 August 2019, made letters of credit mandatory under power purchase agreements and instructed load dispatch centers to schedule power only once they were in place (Power Line 2019).
- Payment security fund. A fund financed from central budgetary support, penalties recovered from developers and interest covers capacity awarded under batches I, III and IV of phase II of the National Solar Mission. Under bidding guidelines amended in October 2019, developers in later tenders deposit Rs 5 lakh per megawatt toward it. The fund does not yet cover other schemes (ICRA 2025).
- Tripartite agreement. Since October 2016 the corporation has been a beneficiary of the tripartite agreement among the central government, the state governments and the Reserve Bank of India (ICRA 2025; Kenning 2017). Under it, a central utility owed money can ask the central government to instruct the Reserve Bank to debit the defaulting state’s account and credit the utility. All but two states and union territories have signed it. The corporation last invoked it in fiscal years 2021 and 2022, against distribution companies in Andhra Pradesh and against HESCOM in Karnataka (ICRA 2025).
- Sovereign support. The central government injected Rs 1,000 crore of equity in March 2022 (ICRA 2025).
Older drafts of this paper said the corporation draws on credit lines with the Reserve Bank of India. The public record does not support that. The Reserve Bank’s role is that of a debiting agent under the tripartite agreement, which works through the state’s own account rather than through central bank credit.
The design has done what Proposition 2 needs. ICRA rates the corporation AAA, citing its sovereign parentage, the tripartite agreement and its collection record (ICRA 2025). The agreement’s value lies as much in deterrence as in use: a state that defaults on the corporation risks a debit to its own account, so the corporation is paid ahead of generators that sell to the state directly. That is the higher recovery \(R_F\) on which the real gain in Proposition 2 depends.
The failure is upstream. The same rating report notes that most state distribution companies remain financially weak, with losses above approved levels and tariffs below cost, that delays from Andhra Pradesh and Karnataka were once large, and that distribution companies’ letter-of-credit coverage is only 68 percent (ICRA 2025). Across the sector the central government has had to act twice. In May 2020 it announced a Rs 90,000 crore liquidity scheme, under which two public finance companies lent to distribution companies against receivables backed by state guarantees so that they could pay generators (CRISIL Ratings 2020). In June 2022 the Electricity (Late Payment Surcharge and Related Matters) Rules let distribution companies pay their accumulated arrears in up to 48 monthly installments (Power Line 2022), with no surcharge accruing on the rescheduled dues while installments are paid on time and the surcharge falling due on the whole amount after a default (Arora et al. 2022). Legacy arrears under the rules fell from Rs 1,39,947 crore on 3 June 2022 to Rs 3,330 crore on 27 March 2026, according to a written reply in Parliament (Press Trust of India 2026).
India’s record therefore confirms both halves of the argument. The intermediary and its waterfall moved the risk away from generators and lowered tariffs. But the risk moved to the central government; it was not removed. The center organized liquidity in 2020 and restructured arrears in 2022, and in both cases most of the money came back because the center could reach the states. That is the waterfall working as Proposition 3 describes, with the national layer paying when called and recovering over time. It is also a warning that a waterfall without utility reform turns into a standing line of credit.
6.2 Nigeria’s bulk trader: a single buyer with nothing behind it
Nigeria created the Nigerian Bulk Electricity Trading company (NBET) under its 2010 roadmap for power sector reform as a single buyer that purchases power from generators and on-sells it to distribution companies (World Bank Group 2024). In form it is a payment intermediary. In the terms of Proposition 3 it lacked what makes one work: recovery from its buyers, an intercept and a funded layer behind it.
The revenue never arrived. In 2017 the government arranged a central bank loan of up to N701 billion through the Ministry of Finance, repayable by the trader over ten years, so that it could pay generators and gas suppliers; at the time the trader expected to collect on average about a quarter of its invoices from the distribution companies (Okafor 2017). In June 2020 the World Bank approved a $750 million credit for Nigeria’s power sector recovery, aimed among other things at reducing the sector’s annual tariff shortfalls (World Bank 2020). An intermediary that collects a quarter of its bills is a conduit for subsidy, not a credit enhancement.
The country’s first project-financed independent power plant shows what happens when guarantees attach to debt as well as to the contract. For the 459-megawatt Azura-Edo gas plant, which reached financial close in December 2015, the World Bank provided guarantees of $238 million: a payment guarantee of up to $120 million backing the trader’s payment security obligations under the power purchase agreement, and a guarantee of up to $118 million that allowed a commercial debt tranche, alongside political risk cover from the Multilateral Investment Guarantee Agency (World Bank Group 2024). Because the government would not give a sovereign guarantee, it signed a put-and-call option agreement instead. If the power purchase agreement ends early, the project company can put the plant to the government, which must pay a price that at a minimum covers the outstanding debt. The World Bank Group’s case study describes this as support “with no negative impact on FGN’s balance sheet” (World Bank Group 2024).
That description shows exactly the accounting problem Section 8 addresses. The payment guarantee is a contract guarantee in the sense of this paper, capped and tied to the trader’s obligations. The put option is a debt guarantee with a delay: its trigger is the failure of the contract, and its payout is the face value of the debt. In the terms of Proposition 2, it has the large maximum exposure of a debt guarantee and none of the recovery of a contract guarantee, since once the government owns the plant there is no one left to recover from. It is a contingent liability of the state and should be recorded as one.
6.3 Zambia and the regional liquidity facility: contract guarantees at small scale
Smaller instruments in Africa already guarantee the contract rather than the debt. Under the World Bank Group’s Scaling Solar program, Zambia tendered two plants on standard power purchase and government support agreements in 2016; the 47.5-megawatt West Lunga plant was awarded at 6.015 US cents per kilowatt-hour on a 25-year fixed-price contract with the state utility ZESCO, then the lowest solar tariff in Sub-Saharan Africa (World Bank Group 2018). ZESCO had to provide payment security by letter of credit, and could do so only with an IDA payment guarantee behind it; every bidder in the first round asked for one. For West Lunga the guarantee was $3.5 million, using less than $1 million of Zambia’s IDA allocation, against about $60 million of investment (World Bank Group 2018). That is a contract guarantee sized to a few months of arrears, not to the debt.
The African Trade Insurance Agency’s Regional Liquidity Support Facility does the same across borders. Launched in 2017 with €63.2 million, half a German grant through KfW and half the agency’s own guarantees, it gives a commercial bank cash collateral to open a standby letter of credit for an independent power producer, covering up to six months of operation and debt service if a state-owned buyer pays late (Wass 2017). It is a regional liquidity buffer in the sense of equation 8, without the layers below it. Both instruments show that multilateral contract guarantees work and are cheap relative to the investment they support. What neither does is pool many contracts behind one standard agreement, collect arrears as a repeat creditor or bind a national intercept in advance, which is what the facility adds.
7 Design
7.1 Tariff profile: declining, not flat
A flat real tariff for 20 years locks the offtaker into the price of the year the contract was signed. If the cost of new solar halves, the offtaker pays double the going rate for the rest of the contract, and its government comes under pressure to renegotiate. Renegotiation is itself a form of default, so a flat tariff raises \(\lambda\).
A declining tariff reduces the exposure without changing the present value. At an 8 percent discount rate, a tariff that starts at 7.74 cents and falls in a straight line to 3.87 cents by year 7, then stays flat, has the same present value over 20 years as a flat 5 cents (stylized). By year 7 the value of the payments still due is 23 percent lower under the declining tariff, 30.6 against 39.5 cent-kilowatt-hour-years. If the cost of new solar falls from 5 to 2.5 cents over the same seven years, the part of the remaining payments above new-build cost is 45 percent lower, 10.8 against 19.8. Earlier drafts proposed a tariff of 6 cents falling to 3 cents as equivalent in present value to a flat 5 cents; at 8 percent it is worth 22 percent less, so developers would not accept it.
The declining tariff therefore saves nothing in present value. What it buys is a contract that stays close to the market price and so is less tempting to break, and a smaller outstanding obligation for the guarantors in later years. The cost is a higher starting tariff, which falls on the offtaker when solar is still a small share of its purchases. The facility should index the decline to a conservative published path rather than to forecasts of technology costs.
7.2 One currency rule
Contract in the currency the offtaker earns. A distribution company earns local currency. A tariff in dollars hands it, and behind it the state, the devaluation risk of every contract, and that risk arrives when the state can least bear it, in a balance of payments crisis. In the model it makes \(\lambda\) and the offtakers’ correlation \(\rho\) rise together, which is the worst case for the buffer in equation 8.
Where projects are financed in foreign currency, the facility, not the offtaker, should decide how the mismatch is held, and it should be priced in the open. It can buy hedges from specialist providers where they exist; index only the share of the tariff that pays for imported equipment, for a limited period; or fund the contracts from domestic savings, which removes the mismatch at source. Paper 3.2 sets out a local-currency senior tranche for domestic savers (Stretton 2026b). The rule excludes one practice: a hard-currency tariff whose currency risk is never priced because the state’s guarantee hides it.
7.3 National or regional
Large markets should build national facilities. India, Nigeria and Brazil each have enough distribution companies, and enough procurement, to diversify across offtakers and to justify a specialist institution. A national facility can rely on a domestic intercept like India’s tripartite agreement, which gives the national layer a high probability of paying.
Small states should share a regional facility. A facility serving, for example, the members of the Economic Community of West African States would spread the fixed costs of standard contracts, procurement and collection across many projects, and diversify across offtakers whose utilities fail for different reasons. But a regional facility has a weaker national layer. No regional facility has an intercept as direct as India’s, so \(q_2\) is lower and the multilateral and donor layers bear more (equation 7). Members can strengthen it by depositing letters of credit or reserves with the facility, by agreeing to offset arrears against transfers they receive from regional institutions, and by giving the facility’s claims the same seniority as their obligations to multilateral lenders.
7.4 Countries in debt distress: energy as a service
A country that cannot borrow more can still buy clean power. The facility, or a private developer under its standard contract, owns and finances the plant, and the state’s utility buys the electricity per kilowatt-hour. The state replaces an open-ended, foreign-currency fuel bill with a fixed and, under a declining tariff, falling local-currency one.
This changes the form of the state’s obligation, not its existence. A long-term take-or-pay power purchase agreement is a fiscal commitment, and a guarantee behind it is a contingent liability. Earlier versions of this proposal described the arrangement as outside the debt stock and protected by the World Bank Group’s preferred creditor status; neither claim survives scrutiny, and this paper drops both. The defensible claim is narrower: the commitment is smaller than the fuel bill it replaces, its terms are fixed and known, and it falls due only if the state’s own utility fails to pay. Debt sustainability analysis should count it, and should also count the fuel import bill it removes.
7.5 Conditionality on utility reform
A guarantee makes the generator whole; it does not make the utility solvent. India’s arrears show what happens when the waterfall is not matched by reform: the national layer pays repeatedly, and a contingent liability becomes a recurrent one. A country that will not put its utility on a path to cost recovery is asking the guarantors to insure a certain loss rather than a risk.
Entry to the facility should therefore be conditional, and access should widen as the conditions are met. The conditions follow from the model. A published path of tariffs toward cost recovery, and an explicit budget transfer for any subsidy that remains, lower the frequency of episodes \(\lambda\). Letters of credit and an intercept agreement raise the recovery \(R_F\) and the national layer’s probability \(q_2\). Targets for collection and loss reduction lower \(\lambda\) over time. Because cheap solar lowers the utility’s cost of supply, reform and the facility reinforce each other: the facility makes the tariff path shorter, and the tariff path makes the facility cheaper. Sustainability-linked sovereign lending, discussed in Paper 4.3 (Stretton 2026a), is one way to pay for the reforms.
8 Fiscal accounting of the contingent liability
The facility does not make the state’s exposure disappear. It changes its form in three ways: it becomes smaller, if the facility recovers more than generators would and reform conditions lower the frequency of default; it becomes contingent, because the state pays only when its own utility fails to; and it becomes contracted, because the waterfall fixes in advance who pays, in what order and up to what cap.
The comparison that matters is with what the state already holds. Before the facility, the state bears its utilities’ arrears implicitly. India’s liquidity scheme of 2020 and its rescheduling of arrears in 2022, and Nigeria’s central bank facility of 2017, are implicit contingent liabilities falling due, in the classification of Polackova (1998). The facility converts part of this implicit liability into an explicit one with a cap and a price. The state’s total exposure to its utilities need not rise, and the reform conditions should make it fall.
The facility’s layers should be recorded at their expected cost. The IMF’s Government Finance Statistics Manual records, as a liability, provisions for the expected calls under standardized guarantee schemes, where many similar guarantees are issued on the same terms, while one-off guarantees are treated as contingent liabilities (International Monetary Fund 2014). A facility with one standard power purchase agreement and many offtakers is a standardized scheme. The national government should therefore record a provision equal to its expected calls net of expected recovery, \(C_2\) in equation 7 less what it expects to recover from its utility, and disclose the stressed call at a stated confidence level. In the stylized regional facility of Table 4, the national layer’s expected call is 2.2 percent of contract payments a year, before recovery.
The guarantee should also be capped in law and charged for. A cap, set as a multiple of annual contract payments, limits the tail that equation 8 leaves to the national layer. A fee charged to the facility, and passed to the utilities that cause the calls, makes the cost visible, as Irwin (2007) recommends for infrastructure guarantees generally. Terminations and buy-out options such as Nigeria’s put-and-call agreement belong in the same register at their full contingent value, not outside it.
The model’s efficiency ratio carries a fiscal caveat. In the central case all of the contract guarantee’s advantage over its expected cost comes from the market price of risk, which investors stop charging once the state bears the risk. That part is a saving to society only if the state bears the risk more cheaply than investors. When the utility’s default is correlated with the state’s own fiscal stress, as in a currency crisis, the state is a poor holder of that risk, and the multilateral and donor layers earn their place by holding the correlated tail.
9 Objections and limits
Single buyers fail. The strongest objection is the World Bank’s own: a single buyer in a developing country invites corruption, weakens payment discipline and puts contingent liabilities on the government (Lovei 2000). Nigeria’s bulk trader bears it out. The facility answers each charge by design rather than by assertion. It is not a monopoly buyer of all power, only of the renewable output contracted under its standard agreement, and other buyers and sellers remain free to trade, which is the condition the later World Bank review attached to centralized purchasing (Arizu et al. 2006). Procurement is separated from payment: prices are set by open auction, and the facility only pays and collects to fixed rules, which limits the room for favored contracts. Payment discipline is kept, because the distribution company’s obligation stays alive and passes to a creditor with an intercept. The contingent liability is the subject of Section 8: it is recorded, capped and priced, rather than denied.
It only moves risk to the center. That is true and is the point. The center already holds the risk implicitly and pays it in crises, as India did in 2020 and 2022 and Nigeria in 2017. The facility makes the center’s exposure smaller only if it collects better and reform lowers the frequency of default, which Proposition 2 makes explicit; it makes the exposure contingent by placing it behind the utility and its owner, and contracted by fixing its order and cap in advance. The alternative is to pay the offtaker premium on every project, every year, for the life of every contract.
Moral hazard. A distribution company that knows its generators will be paid may pay later. The waterfall’s order is the answer: the first calls fall on the company’s own owner, then on the national transfers to that owner, so the cost of non-payment comes back to the government that controls the utility. India’s deterrent effect, a debit to the state’s own account, is the working example.
Correlated crises. A devaluation or fuel shock can push most offtakers into arrears together, and the layers that should pay are stressed at the same time. The buffer in equation 8 and a multilateral layer outside the country are the defense; an underfunded facility fails exactly when it is needed.
The calibration is stylized. Frequency, length and recovery of default episodes are not estimated for any named utility, and the price of risk is a round number. The results that do not depend on them are the form of the premium, the ranking of the two guarantees under the recovery condition, and the decomposition of the gain into transfer and real saving.
10 Policy implications
What to build. Governments whose distribution companies buy most of the power should create, or join, a payment intermediary facility with one standard power purchase agreement and a guarantee waterfall signed before the first tender. Large countries should build national facilities; small countries should share regional ones with a stronger multilateral layer. New utility-scale renewable procurement should run through the facility, in local currency and on declining tariffs.
What it costs. In the stylized calibration the facility needs a margin of a few percent of contract payments, like India’s 2.4 percent, and a liquidity buffer of about a third of a year’s payments. The layers behind it expect to be called for about 5.5 percent of payments a year, mostly by the offtakers’ own owners and partly recoverable. Against this, the contract guarantee removes an offtaker premium worth about 11 percent of the tariff in the central case, about two dollars of saving per dollar of expected cost, and more if the facility collects well.
Who should do what. Finance ministries should sign the intercept, set the reform conditions and record their layer at expected cost under a published cap. Regulators should require letters of credit and enforce dispatch rules like India’s. Development banks should guarantee the facility, or stand as its multilateral layer, rather than guaranteeing individual project loans; IDA payment guarantees of the Scaling Solar kind can be pooled behind a facility instead of written plant by plant. Donors should fund the contingency account at the bottom of the waterfall. Once the contracts are standard and guaranteed, the plants they support can be refinanced as a few homogeneous asset classes through two-stage finance and synthetic sovereign bonds (Stretton 2026b, 2026c), with first-loss capital from the regional funds of a Climate Investment Trust (Stretton 2026d).
When it fails. The recommendation fails under four conditions. If utility losses are structural and reform does not come, the waterfall becomes a channel for a permanent subsidy, and the honest instrument is an explicit budget transfer. If the national layer cannot or will not pay, as in a regional facility without an intercept, the cost shifts to multilateral and donor layers that may not be willing to bear it. If a common shock drives most offtakers into arrears together, the buffer in equation 8 must be large, and an underfunded facility fails exactly when it is needed. And if the facility is captured, signing contracts above cost for favored developers, it spreads the cost of bad contracts across the whole system; separating procurement from payment is the safeguard.
11 Conclusion
The payment risk of a state utility is the part of the cost of clean power that a developing country can most easily remove, and a payment intermediary facility removes it by guaranteeing the contract rather than the debt. The model shows that the offtaker premium depends on the length of arrears and on recovery, both of which an intermediary can change; that a contract guarantee removes the whole premium, at a lower cost per dollar saved than a debt guarantee whenever its recovery is at least as good, and at a fraction of the exposure; and that a layered waterfall puts the expected cost on the offtakers’ owners and keeps the facility insolvency-remote if it holds enough liquidity for correlated arrears. It also shows what the case does not establish: without better collection or fewer defaults, the guarantee moves risk to the state rather than removing it. India’s Solar Energy Corporation confirms the mechanism and its limit: generators were paid, but the center had to fund the distribution companies twice.
The next step is empirical: estimating the frequency, length and recovery of default episodes for named utilities from payment data such as India’s PRAAPTI portal, and comparing tariffs in intermediated and direct auctions to measure the offtaker premium that Proposition 1 describes and the recovery on which Proposition 2’s real gain depends.
Downloads
References
Appendix A: Proofs
Proposition 1. Model the offtaker as an alternating renewal process: normal periods with exponential length of mean \(1/\lambda^Q\) under the pricing measure, and episodes of fixed length \(D\). By the renewal–reward theorem the long-run share of time in an episode is \(D/(1/\lambda^Q + D) = \varphi(\lambda^Q)\). A payment due at time \(s \in [0, D]\) after the start of an episode is paid, in fraction \(R\), at time \(D\); its value at the time it fell due is \(Re^{-r_0(D-s)}\). Averaging over \(s\) uniformly on \([0, D]\) gives \(R(1 - e^{-r_0 D})/(r_0 D) = \tilde R\). In the stationary regime, therefore, each contracted dollar is worth \((1 - \varphi) + \varphi\tilde R = 1 - h\) in expectation under the pricing measure, where \(h = \varphi(\lambda^Q)(1 - \tilde R)\). The generator breaks even when the value of contracted payments, \((1-h)PE/a(r_0)\), equals the value of costs, \(I + F/a(r_0)\); solving gives \(P^{*} = \mathrm{LCOE}(r_0)/(1-h)\). The comparative statics follow because \(\varphi\) is increasing in \(\lambda^Q = m\lambda\) and in \(D\), \(\tilde R\) is increasing in \(R\) and decreasing in \(D\), and \(h/(1-h)\) is increasing in \(h\). Since \(\mathrm{LCOE}(r)\) is continuous and strictly increasing in \(r\), a unique \(r^{*}\) solves \(\mathrm{LCOE}(r^{*}) = P^{*}\). The approximation \(r^{*} - r_0 \approx \mathrm{LCOE}(r_0)\,h/[(1-h)\,\mathrm{LCOE}'(r_0)]\) holds for small \(h\).
Proposition 2. (i) Under a contract guarantee the generator receives every contracted dollar, so \(h\) is replaced by zero in Proposition 1. Under a debt guarantee the share \(\theta\) of the haircut that would have fallen on lenders is borne by the guarantor, so the project’s haircut is \((1-\theta)h\); since \(1/(1-x)\) is increasing, \(P_D \ge P_C\) with equality iff \((1-\theta)h = 0\). The contract guarantee attaches to the offtaker’s obligation, which is identical across the standard contracts it has signed, so a single guarantee covers all of them. (ii) Under the physical measure the facility funds a share \(\varphi(\lambda)\) of contracted payments and recovers from the offtaker, in present value at the time each payment fell due, \(R_F(1 - e^{-r_0 D})/(r_0 D) = \tilde R_F\); the remainder, \(\varphi(\lambda)(1 - \tilde R_F)\), is paid by the facility and the layers behind it. In any episode the facility pays at most the payments due during the episode, \(AD\). The debt guarantor pays the share \(\theta\) of offtaker losses that reaches lenders and recovers \(\tilde R_D\) of it, plus the expected cost \(\psi\) of other events; on acceleration it pays the outstanding principal. (iii) Dividing the loss removed by the expected cost gives equation 6, using \(h = \varphi(m\lambda)(1-\tilde R)\); the factor \(\theta\) cancels in the debt guarantee’s ratio on offtaker risk. The contract guarantee is at least as efficient iff \((1 - \tilde R_F) \le (1 - \tilde R_D)\), that is iff \(\tilde R_F \ge \tilde R_D\); including \(\psi > 0\) in the debt guarantor’s cost only lowers its ratio further. Finally \(h/c_C \ge 1\) iff \(\varphi(m\lambda)(1 - \tilde R) \ge \varphi(\lambda)(1 - \tilde R_F)\), which holds when \(m \ge 1\) (so \(\varphi(m\lambda) \ge \varphi(\lambda)\)) and \(\tilde R_F \ge \tilde R\), with equality when both hold with equality.
Proposition 3. (i) The expected shortfall not recovered from offtakers is \(\varphi(\lambda)A(1 - \tilde R_F)\) a year. It reaches layer \(k\) only if each layer \(j < k\) fails to pay, which happens with probability \(\prod_{j<k}(1-q_j)\) by independence, and layer \(k\) then pays with probability \(q_k\). The facility bears what no layer pays. If \(q_K = 1\) the product \(\prod_{k \le K}(1 - q_k)\) is zero, and the calls sum to \(\varphi(\lambda)A(1 - \tilde R_F) = c_C A\). (ii) In the one-factor model, offtaker \(i\) enters an episode within the year if \(\sqrt{\rho}Z + \sqrt{1-\rho}\varepsilon_i < \Phi^{-1}(p)\), with \(Z\) and \(\varepsilon_i\) independent standard normal. As \(M \to \infty\), the share entering episodes conditional on \(Z\) converges to \(\Phi\big((\Phi^{-1}(p) - \sqrt{\rho}Z)/\sqrt{1-\rho}\big)\), which is decreasing in \(Z\), so its \(1 - \varepsilon\) quantile is obtained at \(Z = -\Phi^{-1}(1-\varepsilon)\) (Vasicek 2002). With one-year episodes, offtakers that entered an episode within the year are approximately those in arrears at its end. With equal contract sizes the facility must fund this share of payments for \(H\) years before a layer provides funds, which gives equation 8. If \(B\) meets the bound and the last layer’s committed capacity covers the shortfall reaching it at the same quantile, generators are paid in full in all but an \(\varepsilon\) share of years, and losses fall only on the layers.
Appendix B: Calibration parameters and code
| Parameter | Value | Status |
|---|---|---|
| Plant cost; capacity factor; O&M; life | $800/kW; 20%; $12/kW-yr; 25 years | Stylized, series 3 common plant |
| WACC excluding offtaker risk, \(r_0\) | 8% real | Stylized |
| Episode intensity \(\lambda\); length \(D\); recovery \(R\) | 0.15/yr; 1 year; 60% | Stylized |
| Price of default risk \(m\) | 2 (1 as sensitivity) | Stylized; direction from Driessen (2005) |
| Facility’s recovery from the offtaker \(R_F\) | 60% at episode end (80% as sensitivity) | Stylized; central case equal to \(R\) |
| Debt share \(g\); share of offtaker loss on lenders \(\theta\) | 75%; 0.3 | Stylized |
| Debt guarantor recovery \(R_D\), lag \(D_D\) | 50%, 3 years | Stylized |
| Other risks covered by a debt guarantee | 1%/yr intensity, 30% loss on debt | Stylized |
| Waterfall probabilities \(q\): subnational, national, multilateral, donor | 0.5, 0.8, 0.9, 1.0 | Stylized |
| Regional facility: capacity; correlation \(\rho\); confidence; bridge \(H\) | 2 GW; 0.3; 99.5%; 0.5 years | Stylized |
| SECI trading margin; weighted average sale tariff; capacity under sale agreements | Rs 0.07/kWh; Rs 2.93/kWh; about 60 GW | ICRA (2025) |
| SECI developer deposit to payment security fund | Rs 5 lakh/MW | ICRA (2025) |
2.Source/model.py implements the equations of Section 4 and prints every number quoted in Section 5 and Section 7; it writes 2.Source/calibration_tables.csv. 2.Source/make_wp_figures.py draws the four figures. Both run with Python 3 and matplotlib. Version 0.3 corrects the contract guarantee’s expected cost: version 0.2 counted payments by the layers of the waterfall as recovery (a 95 percent recovery rate) and so reported $5.3 of saving per dollar of cost, against $2.0 on the consistent basis used here.
Footnotes
This paper consolidates and replaces earlier statements of the same architecture. The guarantee waterfall comes from a policy brief on regional renewable energy payment intermediary facilities written with Nils Zimmermann (2024). The treatment of small and debt-distressed states draws on the solar payments intermediary proposal developed by Evie Davey. The two-stage refinancing that Paper 3.2 develops came with Jasper Zimmermann. Errors are mine.↩︎