From Projects to Asset Classes
Two-Stage Finance and Synthetic Sovereign Bonds for Clean Power
Solar and wind plants in developing countries are financed one at a time, on bespoke terms, by lenders who price construction, payment, currency and sovereign risk together for the life of the loan. For a plant with no fuel bill, that cost of capital is most of the price of power. This paper proposes turning such projects into a few standard securities. Banks and development finance institutions finance construction against a contingent purchase contract; on completion, each plant’s senior debt is refinanced into a pool that issues a first-loss tranche, a thin mezzanine and a senior synthetic sovereign bond, rated on guaranteed contracts, the cushion beneath it and a co-guarantee from highly rated sovereigns. A one-factor portfolio model shows that subordination of 5 to 8 percent makes the senior bond near-AAA in a large pool of operating plants at default correlations of 0.10 to 0.20, that pooling across countries removes about 40 percent of the cushion a single-country pool needs, and that refinancing cuts the levelized cost of solar power by about a fifth. Real securitizations carry thicker cushions; with 30 percent subordination the saving is still 14 percent. Where no contract exists, as for transmission, a tiered and conditional bond guarantee plays the same role.
renewable energy finance, securitization, credit enhancement, cost of capital, guarantees, developing countries
Working paper, version 0.2, October 2026. Stephen J. Stretton, writing in a personal capacity. The views expressed are the author’s own and do not represent those of any institution with which he is or has been affiliated. A short version for policy makers is Climate Fiscal Policy Brief No. 3.2.1
1 Executive summary
Policy brief (short version) → · Download this paper (pdf) · Slides (pdf)
Clean power in developing countries is expensive because its money is expensive. A solar plant has no fuel bill, so the price of its power is mostly the cost of the capital that built it. In this paper’s stylized plant, raising the cost of capital from 4 to 12 percent raises the cost of power by 80 percent, from 3.6 to 6.5 US cents per kilowatt-hour. The International Energy Agency’s survey of financiers found that the cost of capital for utility-scale solar in emerging and developing economies is well over twice that in advanced economies.
Removing payment risk is the first step; packaging is the second. The companion paper proposes a payment intermediary that pays generators on time whatever the state-owned distribution company does. But a guaranteed contract is not yet cheap money. Each plant is still financed alone, on bespoke documents, by a lender who keeps its construction risk for the life of the loan and cannot sell the loan to a pension fund.
The proposal is to split each project at commissioning and standardize both halves. Banks and development finance institutions lend for the two-year build, against the intermediary’s promise to buy the plant’s power on completion. Once the plant runs, its senior debt is refinanced into a pool of operating plants that all carry the same contract. The pool issues three securities: a first-loss tranche, held by a regional equity fund; a thin mezzanine, held by development lenders or replaced by a guarantee from highly rated sovereigns; and a senior “synthetic sovereign bond” that pension funds and insurers can buy. A local-currency version serves domestic savers.
Operating plants are good credits, so the cushion under the senior bond can be thin. Moody’s data on 6,389 project finance loans show default risk high during construction and falling toward single-A levels by year seven; loans that survived their first three years defaulted at under 3 percent over the next seven, and lenders recovered 80 percent on average. A standard portfolio model then shows that a large pool of operating plants needs 5 to 8 percent of losses absorbed beneath the senior bond for a near-AAA standard, at default correlations of 0.10 to 0.20. Correlation matters more than the default rate, and most of it comes from the host government: pooling across ten countries cuts the cushion from 9.1 to 5.3 percent.
Refinancing at the pool’s cost cuts the price of solar power by about a fifth. Against single-stage finance at 10 percent, building at 12 percent and refinancing the senior debt into the pool at a blended 5.65 percent, with the sponsor’s equity still earning 12 percent, lowers the cost of power from 6.2 to 5.0 cents per kilowatt-hour, or 19 percent. A stand-alone project bond saves only 7 percent; the rest comes from pooling and tranching.
The strongest objection is that real securitizations carry far thicker cushions. The first Asian infrastructure loan securitization, Clifford Capital’s Bayfront deal of 2018, put 30 percent of the notes beneath its most senior class. Its pool was small, mixed sectors and included plants still under construction. The model’s 5 to 8 percent is the cushion for a large, standard pool of operating plants; a first issue will carry more. Even at 30 percent, the saving is 14 percent.
The host government’s exposure shrinks but does not vanish. It stands in the guarantee waterfall behind the intermediary and in the tiers of grid guarantees. Those are contingent liabilities, mostly triggered by the government’s own utility or policy. A co-guarantee of the mezzanine on a $10 billion pool costs about $6 million in expected loss over ten years, but $460 million can be drawn in a regional crisis, so guarantors must reserve for the tail.
What to do. Payment intermediaries should write a contingent purchase contract and a published refinancing route into every auction. Development banks should sponsor regional pools under one contract and publish their first-loss sizing. The Climate Investment Trust’s regional funds should hold first loss; highly rated sovereigns should guarantee the mezzanine. Grids and storage, which have no contract, should get tiered bond guarantees conditional on reform.
2 Introduction
A solar farm financed at 12 percent produces power that costs 80 percent more than the same farm financed at 4 percent, and none of the difference is hardware. Solar has no fuel bill, so its tariff is mostly the cost of the money that built it. For a stylized plant costing $800 per kilowatt, the levelized cost of electricity (LCOE) is 3.6 US cents per kilowatt-hour at a 4 percent cost of capital and 6.5 cents at 12 percent; at 10 percent, financing is 56 percent of the price (Table 1). The International Energy Agency’s survey of financiers and investors found that the cost of capital for utility-scale solar in emerging and developing economies is well over twice that in advanced economies, and that financing can be around half or more of the LCOE of solar there (International Energy Agency 2024). At 10 percent, one percentage point off the cost of capital cuts the plant’s annual capital charge by 7.6 percent, as much as cutting the cost of the plant itself by 7.6 percent.
Part of that premium is the risk that the state-owned distribution company buying the power will not pay. The companion paper removes it at source with a payment intermediary facility that pays generators on time whatever the distributor does, backed by a guarantee waterfall contracted in advance (Stretton 2026b, 2026c). But a guaranteed contract is not yet cheap money. Each project is still financed on its own, with bespoke documents, by a lender who carries its construction risk for the life of the loan, prices the host sovereign into every coupon and cannot sell the loan to a pension fund, because no rating agency or investor will analyze one plant at a time.
This paper asks how, once payment risk is removed, individual clean power projects can become standard securities that institutional and domestic savers will buy at low cost. The answer is to split each project at commissioning and standardize each side. Construction is financed by banks and development finance institutions against a contingent power purchase agreement: the intermediary’s commitment, made before construction, to buy the plant’s power on completion. Once the plant operates, its senior debt is refinanced into a pool of operating plants that carry the same contract, and the pool issues tranched securities: a first-loss tranche of equity, a thin mezzanine, and a senior synthetic sovereign bond whose rating comes from the guaranteed contracts, the cushion beneath it and a co-guarantee from highly rated sovereigns, not from the host government. Where there is no contract to guarantee, as for transmission lines and storage, a tiered bond guarantee does the same job, conditional on agreed policy reforms. A local-currency senior tranche gives domestic savers a deposit-like green instrument.
Three results support the proposal, and a fourth tests it. First, separating construction from operation lowers the LCOE whenever the operating-phase cost of capital falls below the single-stage rate, and because operation lasts 25 years against a two-year build, a point off the operating rate is worth about nine to eleven times a point off the construction rate (Proposition 1). Second, in a one-factor portfolio loss model (Vasicek 2002), the subordination needed under a senior bond for a target default probability has a closed form; with operating plants defaulting at 5 percent over ten years and recovering 80 percent, 4.8 to 7.7 percent makes the senior bond near-AAA at default correlations of 0.10 to 0.20 (Proposition 2, Table 2). Third, pooling plants across host countries removes the host-country component of correlation, cutting the subordination needed from 9.1 percent for a single-country pool to 5.3 percent for a pool spread over ten countries (Proposition 3). Refinancing the senior debt at the resulting blended cost of 5.65 percent, against single-stage finance at 10 percent, cuts the LCOE of the stylized plant by 19 percent. Fourth, the result survives the evidence that cuts against it: real securitizations of project loans carry far thicker cushions than the large-pool model, and with 30 percent subordination the saving is still 14 percent (Section 6).
The paper adds to four literatures. Work on the renewable cost of capital shows how large the premium is and how much it matters (Steffen 2020; Egli et al. 2018; Ameli et al. 2021; Calcaterra et al. 2024), but stops at the project. Work on infrastructure finance argues that the binding constraint is a shortage of standard, investable assets rather than of savings (Ehlers 2014), and that infrastructure should become an asset class through co-investment platforms (Arezki et al. 2017); it does not size the credit enhancement such an asset class needs. Work on project finance credit risk shows that default risk is concentrated in construction and falls once a plant operates (Sorge 2004; Moody’s Investors Service 2017), which is the empirical basis for splitting finance at commissioning; securitization has been proposed for solar in the United States (Lowder and Mendelsohn 2013), where the host sovereign is not the issue. Work on structured finance warns that tranche ratings are fragile to correlation (Coval et al. 2009). This paper puts these together: it sizes the first loss for clean power pools explicitly as a function of correlation, recovery and pool size; it shows where the correlation comes from (the host sovereign) and how standard contracts and cross-country pooling remove most of it; and it translates the result into the price of power. The rest of the paper reviews the literature (Section 3), sets out the structure and propositions (Section 4), calibrates them (Section 5), tests them against real structures (Section 6), and then covers grids, currency, precedents, risks and policy.
3 What is known, and the gap
The cost of capital decides the price of clean power. Renewables replace fuel with capital, so their costs are far more sensitive to financing terms than those of fossil plants. In a power system model, a $50 per tonne carbon price yields a cost-optimal mix of about 40 percent renewables at a 3 percent cost of capital and almost none at 15 percent (Hirth and Steckel 2016; Schmidt 2014). Across 46 countries in 2009–2017, developing countries had significantly higher costs of capital for renewables than industrialized ones (Steffen 2020). In Germany, financing terms for solar and onshore wind improved strongly over 18 years, through lower interest rates and learning by lenders (Egli et al. 2018). Modeling studies find that representing regional costs of capital cuts green electricity in a cost-optimal 2°C pathway for Africa by 35 percent, and that converging country risk premia would bring more renewables and cheaper energy to developing regions (Ameli et al. 2021; Calcaterra et al. 2024).
Project finance is the dominant vehicle, and it bundles risks that have different owners. Most renewable plants are financed as non-recourse project finance, which lets sponsors raise high leverage against contracted cash flows (Steffen 2018). Where political risk is high, lenders use it more, and development banks join the syndicate, because it gives them leverage over that risk (Hainz and Kleimeier 2012). The same structure ties one lender to one plant for the whole loan: construction risk, operating risk, payment risk and currency risk sit with one investor. Credit risk in project finance is high at inception and declines over the life of the project (Sorge 2004). Moody’s data on 6,389 projects show the size of the gap. The ten-year cumulative default rate is 6.7 percent, comparable to low investment-grade corporate issuers, but marginal default rates are those of high speculative-grade credits in the first three years after financial close and fall toward single-A levels by year seven; recoveries average 79.5 percent, and in over 60 percent of defaults the lender loses nothing (Moody’s Investors Service 2017). An operating plant is a much better credit than a plant under construction, yet single-stage finance prices both together.
Infrastructure lacks standard assets, not savings. Ehlers (2014) argues that the main obstacle to infrastructure finance is a shortage of investable projects, and that capital markets are under-used; a wider range of instruments would attract more investors and spread risk. Arezki et al. (2017) review the public-private co-investment platforms built to channel long-term savings into infrastructure and set out what it would take to turn infrastructure into an asset class. Blended finance, done one deal at a time, has mobilized little: each dollar of development finance brought in $0.75 of private money across developing countries and $0.37 in low-income ones in 2012–2015 (Attridge and Engen 2019). Green bonds trade at a premium of about 2 basis points over conventional bonds (Zerbib 2019), so labeling alone does not lower the cost of capital; credit quality does.
Securitization turns pools into rated paper, and correlation decides the rating. The one-factor Gaussian model gives the loss distribution of a large pool of loans as a function of the default probability and a single correlation parameter (Vasicek 2002). It underlies the Basel internal-ratings formula (Gordy 2003; Basel Committee on Banking Supervision 2006), which assumes correlations between 0.12 and 0.24 for corporate exposures. Future-flow securitization has long let developing-country issuers borrow above their sovereign ceiling against receivables paid offshore (Ketkar and Ratha 2001), although sovereign ratings still weigh heavily on the ratings of firms in the same country, most where capital controls and political risk are high (Borensztein et al. 2013). The 2007–09 crisis showed the danger: senior tranches are highly sensitive to errors in correlation and default assumptions, and concentrate exposure to systematic risk (Coval et al. 2009). In the United States, securitization of solar assets was proposed as a cheaper source of funding than tax equity (Lowder and Mendelsohn 2013).
Currency is the hidden layer. Countries that cannot borrow abroad in their own currency face currency mismatches whenever they borrow in dollars (Eichengreen et al. 2003). A dollar power contract reproduces the mismatch inside the power sector.
The gap. The literature measures the premium, documents the decline of project risk after construction and argues for an infrastructure asset class, but it does not say how large the loss-absorbing layer must be for clean power pools in developing countries to reach a high rating, how that size depends on correlation with the host sovereign and on the number of plants in the pool, or what the resulting refinancing is worth in cents per kilowatt-hour. This paper does.
4 Two stages and five asset classes
4.1 The structure
Two-stage finance gives each phase of a plant’s life to the investor who prices it most cheaply. In stage one, a developer builds the plant with its own equity and a construction loan from a bank or a development finance institution. The lender supervises a bounded, project-specific risk over about two years. In stage two, once the plant operates, its senior debt is refinanced by a pool of operating plants, which funds itself by issuing tranched securities. The sponsor, or a buyer of its stake, keeps the project’s equity beneath the debt. In the calibration the senior debt is 80 percent of the plant’s cost at commissioning, the gearing Time and Chance assumes for investment-grade clean power debt (Stretton 2026g, ch. 15).
The contingent power purchase agreement links the two stages. Before construction, the payment intermediary facility commits to buy the plant’s power on completion under its standard power purchase agreement (Stretton 2026b). The construction lender then lends against a plant with a contracted, creditworthy buyer waiting for it, rather than against a merchant project. The pool knows in advance what it will be offered: identical contracts, identical documents and an identical buyer. That is what turns the refinancing from a negotiation into a take-out.
The structure creates five standard securities, each for a different investor.
- Construction loan. Two to three years, floating rate, held by banks and development finance institutions, secured on the plant and the contingent power purchase agreement.
- First-loss tranche. Equity in the pool that absorbs portfolio losses before any debt does. At scale its natural holder is a regional fund of the Climate Investment Trust (Stretton 2026e, 2026f).
- Mezzanine. A thin layer between the first loss and the senior bond, held by development finance institutions or by insurers seeking yield, or replaced by a sovereign co-guarantee of the same layer.
- Senior synthetic sovereign bond. A long-dated bond backed by guaranteed contracts on operating plants, a first-loss tranche and a co-guarantee from highly rated sovereigns, rated on that structure rather than on the host sovereign. Its buyers are pension funds, insurers and, if eligible, central banks.
- Local-currency senior tranche. The same senior claim, denominated in the host currency and sold to domestic banks, pension funds and retail savers (Section 8).
The cash waterfall puts bondholders first. Payments under the standard power purchase agreement flow from the intermediary to each plant’s debt service account and from there to the ring-fenced pool, which pays senior interest and principal, then mezzanine, then the first-loss tranche. The bondholder is therefore exposed to the intermediary’s payment and to a diversified set of operating plants, not to any one developer (Stretton 2026g, ch. 7). Behind the intermediary stands the guarantee waterfall of the companion paper: the distribution company, its subnational owner, the national government, a multilateral agency and a donor contingency account (Stretton 2026b).
4.2 Proposition 1: the refinancing gain
Let a plant cost \(C\) per kilowatt, take \(B\) years to build with capital drawn evenly, run for \(T\) years and produce \(E\) kilowatt-hours per kilowatt a year at operating cost \(m\). Under single-stage finance one cost of capital \(r_1\) applies throughout. Under two-stage finance the construction phase costs \(r_c\), and in operation the plant’s cost of capital is \(r_o = g\,r_d + (1-g)\,r_e\), where a share \(g\) of its capitalized cost is senior debt refinanced at \(r_d\) and the rest is project equity earning \(r_e\). With the capital recovery factor \(\mathrm{CRF}(r,T) = r/(1-(1+r)^{-T})\), the LCOE is
\[ \mathrm{LCOE}(r_c, r_o) = \frac{C(1+r_c)^{B/2}\,\mathrm{CRF}(r_o,T) + m}{E}, \tag{1}\]
and single-stage finance is the special case \(r_c = r_o = r_1\).
Proposition 1 (refinancing gain). (a) Two-stage finance lowers the LCOE if and only if \((1+r_c)^{B/2}\mathrm{CRF}(r_o,T) < (1+r_1)^{B/2}\mathrm{CRF}(r_1,T)\); when \(r_c = r_1\) this holds if and only if \(r_o < r_1\). (b) The ratio of the LCOE’s sensitivity to the operating cost of capital and to the construction rate is \(\frac{2(1+r_c)}{B}\cdot\frac{\mathrm{CRF}'(r_o,T)}{\mathrm{CRF}(r_o,T)}\), which for \(r_c = 12\) percent, \(B = 2\), \(T = 25\) and \(r_o\) between 6 and 10 percent lies between 8.6 and 10.6; a point off the refinanced debt rate is worth \(g\) times as much as a point off \(r_o\). (c) The gain is passed to consumers only if the refinancing terms are known when the tariff is bid; otherwise the developer adds a premium for refinancing risk.
The proof is in Appendix A. Part (b) is the heart of the matter. Construction lasts two years and operation twenty-five, so the rate that applies to the long phase dominates the tariff. Single-stage finance carries the construction-era price of risk into the operating years, because the lender cannot shed the risk it priced at the start. A plant built at 12 percent and refinanced at 8 percent stops paying for construction risk the day it is commissioned. Part (c) is why the contingent power purchase agreement and a standing take-out matter: in a competitive auction developers bid the tariff they can finance, and they can bid on the refinanced cost only if refinancing is assured.
The refinancing gain does not shrink when world interest rates rise. If construction finance costs 12 percent and the operating plant 8 percent, the four-point gap is worth at least as much whether the world’s safe rate is 2 or 5 percent. Higher rates raise the financing share of the tariff, from 30 percent at a 4 percent cost of capital to 41 percent at 6 percent (Table 1), so they make the gap more valuable, not less.
4.3 Proposition 2: how much first loss
Model a pool holding the senior debt of \(n\) operating plants, each with a ten-year probability \(p\) of defaulting to the pool and loss given default \(\lambda\). Plant \(i\) defaults when a latent variable \(X_i = \sqrt{\rho}\,Z + \sqrt{1-\rho}\,\varepsilon_i\) falls below \(\Phi^{-1}(p)\), where \(Z\) is a common factor, \(\varepsilon_i\) is idiosyncratic and both are standard normal. The parameter \(\rho\) is the correlation of the latent variables: how much plants fail together. “Default to the pool” means a shortfall that the guarantee waterfall behind the intermediary did not cover: a crisis that exhausts the waterfall, curtailment, a change in law, a plant that underperforms. As \(n\) grows, the fraction of the pool lost converges to
\[ L(Z) = \lambda\,\Phi\!\left(\frac{\Phi^{-1}(p) - \sqrt{\rho}\,Z}{\sqrt{1-\rho}}\right), \tag{2}\]
the large homogeneous pool of Vasicek (2002). A senior tranche that attaches at \(K\), so that it loses only once pool losses exceed \(K\), defaults with probability \(\Pr[L > K]\).
Proposition 2 (first-loss size). In the large homogeneous pool, the senior tranche has default probability at most \(\alpha\) if and only if its attachment point is at least
\[ K^*(p, \rho, \lambda, \alpha) = \lambda\,\Phi\!\left(\frac{\Phi^{-1}(p) + \sqrt{\rho}\,\Phi^{-1}(1-\alpha)}{\sqrt{1-\rho}}\right). \tag{3}\]
\(K^*\) is proportional to \(\lambda\), increasing in \(p\) and decreasing in \(\alpha\). Whenever \(p < 1/2\) and the senior target is stricter than the average plant (\(\alpha \le p\)), \(K^*\) is increasing in \(\rho\).
The proof is in Appendix A. \(K^*\) is the subordination needed: the first-loss tranche plus the mezzanine, or plus a co-guarantee of the mezzanine layer. Three features matter for policy. Subordination scales one for one with loss given default, so recovery rights, which the guarantee waterfall preserves by keeping the claim on the distributor alive (Stretton 2026b), halve the cushion when they halve the loss. Subordination is far above expected loss when correlation is high: at \(p = 5\) percent and \(\lambda = 20\) percent, expected loss is 1 percent of the pool, but a near-AAA senior at \(\rho = 0.2\) needs 7.7 percent. And correlation, not default probability, is the parameter a sponsor can most change, by choosing what goes into the pool. The large-pool formula is a lower bound: a real pool of a few dozen plants keeps some idiosyncratic risk and needs more (Section 6).
The co-guarantee from highly rated sovereigns substitutes for part of the subordination, at a low expected cost. A guarantor that covers the mezzanine layer, losses between the top of the first-loss tranche and \(K^*\), makes the senior bond as safe as if the mezzanine were funded. The guarantor’s expected loss is the expected loss of that layer, which is small because it is drawn only in the correlated tail (Section 5). The guarantor lends its rating at the cost of a reserve against the tail, and spends it only if the tail occurs (Stretton 2026g, ch. 14).
4.4 Proposition 3: standard contracts let pools diversify across host countries
The host sovereign is the main source of correlation. Plants in one country share a currency, a regulator, a distribution sector and, behind the guarantee waterfall, a treasury. When the host sovereign is in crisis, they are stressed together. Write the latent variable of a plant in country \(c\) as \(X_i = \sqrt{\rho_g}\,Z + \sqrt{\rho_c}\,Y_c + \sqrt{1-\rho_g-\rho_c}\,\varepsilon_i\), where \(Z\) is a global factor (world interest rates, the dollar) and \(Y_c\) a host-country factor, independent across countries. A pool confined to one country has correlation \(\rho_g + \rho_c\). A pool spread equally over \(N\) countries, each holding many plants, loses \(L_N = \frac{1}{N}\sum_{c=1}^N L_c(Z, Y_c)\).
Proposition 3 (diversification across host countries). As \(N \to \infty\), \(L_N\) converges almost surely to the one-factor loss with correlation \(\rho_g\), and the subordination needed for a senior target \(\alpha\) converges to \(K^*(p, \rho_g, \lambda, \alpha)\), which is strictly below the single-country requirement \(K^*(p, \rho_g + \rho_c, \lambda, \alpha)\) whenever \(\rho_c > 0\), \(p < 1/2\) and \(\alpha \le p\).
The proof is in Appendix A. Diversification across host countries removes the host-country factor, but not the global one. Three countries capture about two-thirds of the gain and ten capture nearly 90 percent (Table 5). The result assumes the plants in different countries can be pooled at all, and that is where standardization does its work. A pool can be rated as homogeneous only if its assets carry the same contract, the same documents and comparable loss given default. Bespoke contracts force investors and rating agencies to analyze each asset, which makes the pool effectively small, and a small pool keeps its idiosyncratic risk (Gordy 2003). Identical contracts make portfolios; portfolios make ratings. A regional payment intermediary, which buys power from several countries under one standard power purchase agreement, produces exactly the homogeneous, multi-country pool that Proposition 3 rewards (Stretton 2026b).
5 Calibration: a stylized solar portfolio
The calibration uses a stylized plant and default parameters anchored to public data. The plant costs $800 per kilowatt, has a 20 percent capacity factor (1,752 kilowatt-hours per kilowatt a year), operating costs of $12 per kilowatt a year and a 25-year operating life, as in the series’ LCOE table (Stretton 2026c). Rates are stylized US dollar rates, read as real like the rest of the series; every comparison is between rates on the same basis. The pool parameters are stylized but bracketed by data. The base ten-year default probability of an operating plant, \(p = 5\) percent, is conservative. Moody’s cumulative default rate is 4.01 percent by year 3 and 6.74 percent by year 10, so loans that survived their first three years defaulted at about 2.8 percent over the next seven (Moody’s Investors Service 2017). A stress case uses \(p = 10\) percent, near the 10.2 percent ten-year rate Moody’s reports for projects in lower-middle-income economies. Loss given default is 20 percent in the base case, from the 79.5 percent average recovery and 81.2 percent for operation-phase defaults, and 28 percent in the stress case, from the 72.0 percent recovery in lower-middle-income economies (Moody’s Investors Service 2017); the development finance institutions’ consortium reports a similar 72.2 percent average recovery on private lending in emerging markets (International Finance Corporation 2024). Correlations from 0.05 to 0.30 span the 0.12 to 0.24 assumed for corporates in the Basel formula (Basel Committee on Banking Supervision 2006). Senior targets are ten-year default probabilities of 0.1, 0.5 and 1 percent. For comparison, Moody’s Baa-rated corporates defaulted at 3.78 percent over ten years (Moody’s Investors Service 2017), so a 1 percent target is well inside investment grade and 0.1 percent is near the top of the scale; the labels in Table 2 are indicative, not rating-agency mappings.
2.Source/model.py).
| Cost of capital | 4% | 6% | 8% | 10% | 12% | 15% |
|---|---|---|---|---|---|---|
| LCOE (US cents/kWh) | 3.6 | 4.3 | 5.0 | 5.7 | 6.5 | 7.8 |
| Relative to 4% | 1.00 | 1.18 | 1.38 | 1.58 | 1.80 | 2.15 |
| Financing share of LCOE | 30% | 41% | 49% | 56% | 61% | 68% |
Subordination of 5 to 8 percent makes the senior bond near-AAA at moderate correlation in a large pool. Table 2 applies Proposition 2. With the base parameters, a near-AAA senior bond needs 4.8 percent subordination at \(\rho = 0.10\) and 7.7 percent at \(\rho = 0.20\); an investment-grade senior needs 3.4 and 5.0 percent. Halving recovery from 80 to 60 percent doubles every figure. In the stress case for lower-middle-income countries the near-AAA requirement rises to 10.5 percent at \(\rho = 0.10\) and 15.3 percent at \(\rho = 0.20\). The 5 percent equity buffer proposed in Time and Chance is enough for a near-AAA senior bond only if correlation is low or recovery high; a well-diversified, standardized pool meets that condition, and a single-country pool does not.
2.Source/model.py), with parameters from Moody’s Investors Service (2017).
| Correlation ρ | Near-AAA (PD 0.1%) | Strong IG (PD 0.5%) | IG (PD 1.0%) | Near-AAA, recovery 60% | Near-AAA, LMIC stress |
|---|---|---|---|---|---|
| 0.05 | 3.3% | 2.7% | 2.5% | 6.6% | 7.6% |
| 0.10 | 4.8% | 3.8% | 3.4% | 9.6% | 10.5% |
| 0.20 | 7.7% | 5.8% | 5.0% | 15.4% | 15.3% |
| 0.30 | 10.5% | 7.8% | 6.6% | 20.9% | 19.3% |
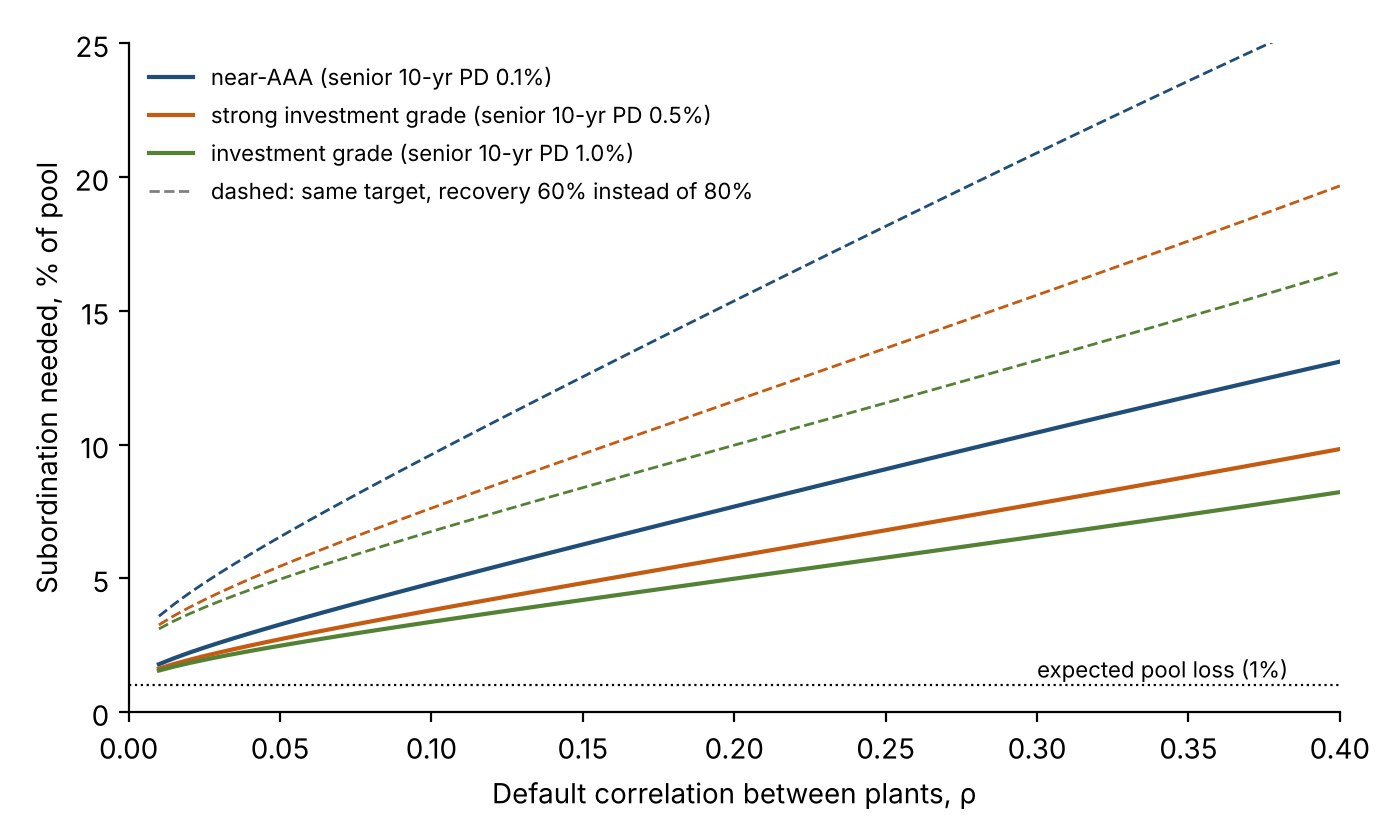
2.Source/make_wp_figures.py).
A near-AAA structure at ρ = 0.20 has a blended cost of about 5.65 percent. Split the 7.7 percent subordination into a first-loss tranche that absorbs losses up to the point where a mezzanine would have a 5 percent ten-year default probability, and a mezzanine above it. That gives first loss of 3.1 percent, mezzanine of 4.6 percent and a senior bond of 92.3 percent (Table 3). With stylized required returns of 12 percent on the first loss, 8 percent on the mezzanine and 5 percent on the senior bond, plus 0.3 percent a year for structuring, servicing and guarantee fees, the blended cost of the pool is 5.65 percent. In the lower-middle-income stress case, first loss rises to 7.6 percent and mezzanine to 7.7 percent, and the blended cost to 6.06 percent. The cost barely depends on the default assumptions: doubling default risk and raising loss severity by 40 percent adds less than half a point, because the senior bond’s yield barely moves.
2.Source/model.py).
| First loss | Mezzanine | Senior bond | Pool | |
|---|---|---|---|---|
| Share of pool | 3.1% | 4.6% | 92.3% | 100% |
| Required return (stylized) | 12% | 8% | 5% | 5.65%* |
| Expected loss over 10 years, % of tranche | 30% | 1.25% | 0.001% | 1.0% |
The sovereign co-guarantee is cheap in expectation and large in the tail. If highly rated sovereigns guarantee the mezzanine layer instead of funding it, the guarantee covers 4.6 percent of the pool. Its expected loss over ten years is 1.25 percent of the layer, or 0.06 percent of the pool. On a $10 billion pool, that is a $460 million guarantee with an expected cost of about $6 million over ten years, or roughly 0.13 percent of the guaranteed amount a year. In the correlated tail the whole $460 million can be drawn. The guarantor should hold capital against that tail and charge for it; such guarantees are cheap in expectation and expensive in a crisis (Stretton 2026g, ch. 14). This ratio is not the series 4 incentive multiplier, which measures the interest saved by a sovereign borrower per dollar of a guarantor’s expected cost (Stretton 2026e).
Refinancing the senior debt at the pool’s cost cuts the LCOE by about a fifth. Table 4 and Figure 2 apply Proposition 1. Construction takes two years at 12 percent in every two-stage case, and in operation 80 percent of the capitalized cost is senior debt and 20 percent project equity earning a stylized 12 percent. Against single-stage finance at 10 percent, consistent with a cost of capital well over twice that in advanced economies (International Energy Agency 2024), refinancing the senior debt into a stand-alone project bond at 8 percent cuts the LCOE by 7 percent; refinancing it into the pool at 5.65 percent cuts it by 19 percent, from 6.2 to 5.0 cents per kilowatt-hour. The saving beyond a single project bond comes from tranching: the pool sells 92 percent of its liabilities at a near-sovereign yield. With project equity at 10 percent the saving is 21 percent, and at 14 percent it is 16 percent. In the lower-middle-income stress case the operating cost of capital is 7.25 percent and the saving 17 percent.
2.Source/model.py).
| Financing | Construction | Senior debt in operation | Operating cost of capital | LCOE (US c/kWh) | Change vs single-stage 10% |
|---|---|---|---|---|---|
| Single-stage | 12% | 12% (single rate) | 12.0% | 7.21 | +16% |
| Single-stage | 10% | 10% (single rate) | 10.0% | 6.22 | — |
| Two-stage, project bond | 12% | 8% | 8.8% | 5.81 | −7% |
| Two-stage, pooled and tranched | 12% | 5.65% | 6.9% | 5.04 | −19% |
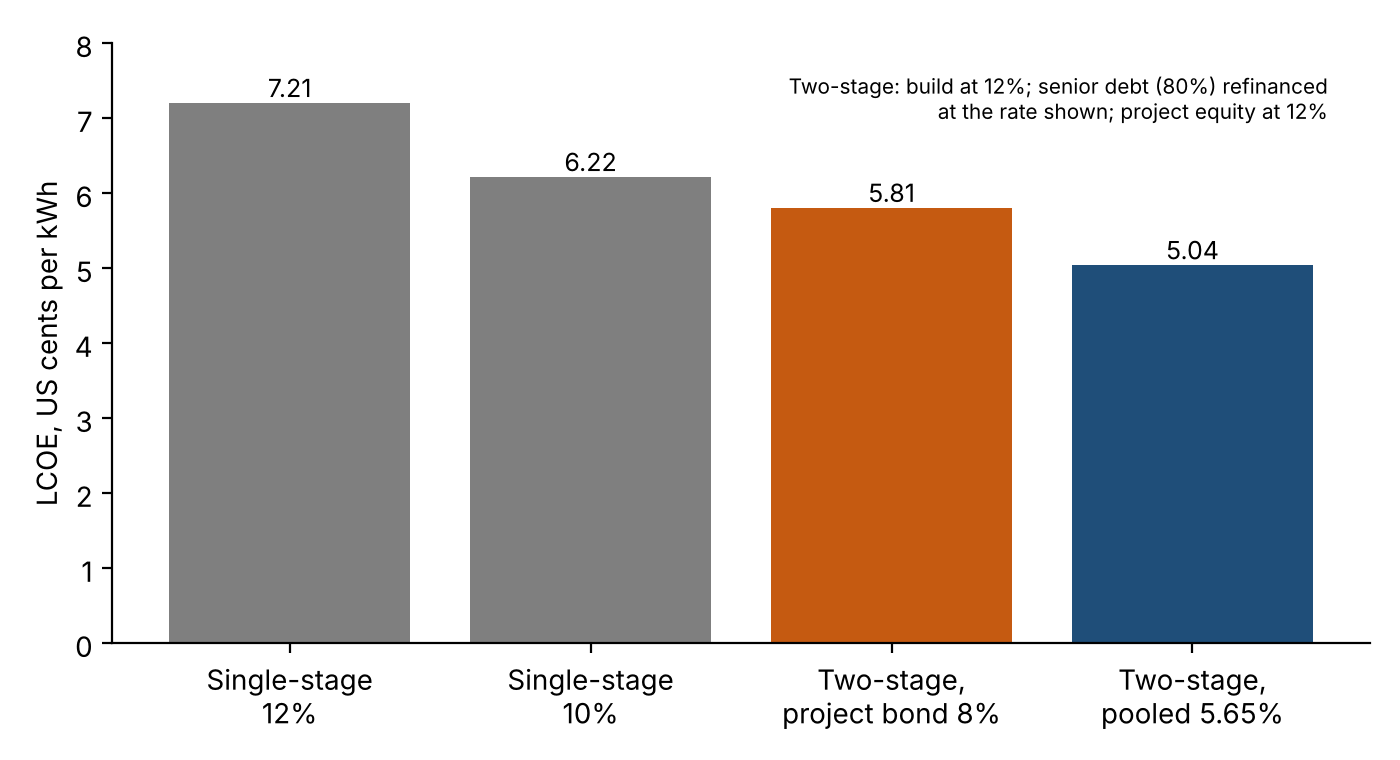
2.Source/make_wp_figures.py).
Pooling across ten host countries cuts the subordination needed by about 40 percent. Table 5 and Figure 3 apply Proposition 3 with a global correlation of 0.10 and a host-country correlation of 0.15, so a single-country pool has correlation 0.25. A near-AAA senior bond on a single-country pool needs 9.1 percent subordination; on a pool spread over three countries, 6.3 percent; over ten, 5.3 percent; the limit is 4.8 percent. The parameters are stylized; the shape is not. Most of the first loss in a single-country pool pays for the host sovereign, and cross-country pooling under one standard contract is what removes it.
2.Source/model.py).
| Host countries in pool, N | 1 | 3 | 5 | 10 | 20 | Limit |
|---|---|---|---|---|---|---|
| Subordination for near-AAA senior | 9.1% | 6.3% | 5.7% | 5.3% | 5.1% | 4.8% |
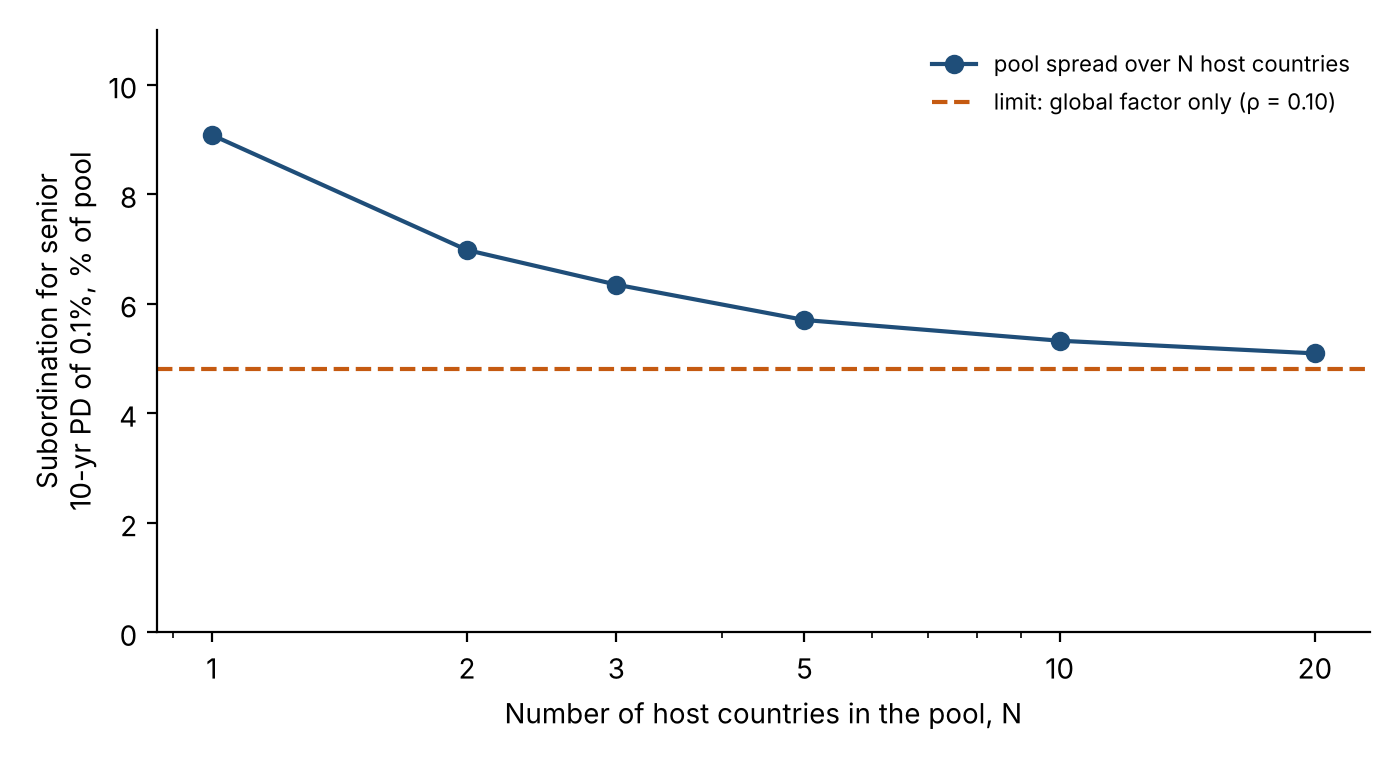
2.Source/make_wp_figures.py).
At scale the equity need is tens of billions of dollars, not trillions. On the author’s own estimate, solar investment in emerging and developing economies other than China needs roughly $2.0–2.5 trillion over a decade, of which $1.6–2.0 trillion could be investment-grade debt at 80 percent gearing (Stretton 2026g, ch. 15). Applying the 3 to 8 percent first-loss range of Table 3 and its stress case to $1.6–2.0 trillion of refinanced debt gives first-loss capital of roughly $50–160 billion, recycled as pools are refinanced. That is the order of magnitude the Climate Investment Trust’s regional funds are designed to supply (Stretton 2026e). These are indicative sums on stylized parameters; they show scale, not a forecast.
6 Testing the result against real structures
Real securitizations of project loans carry much thicker cushions than the large-pool model, and this is the strongest objection to the paper. Clifford Capital’s first Bayfront transaction, in 2018, securitized $458 million of 37 loans to 30 projects in 16 Asian and Middle Eastern countries, bought from five banks; three-quarters of the projects were operating (Global Trade Review 2018). Its most senior class, $320.6 million of Class A notes, was 70 percent of the notes; Class B, Class C and $45.8 million of subordinated notes retained by the sponsor sat beneath it (Allen & Gledhill 2018). Thirty percent of subordination under the top class is four to six times the 4.8 to 7.7 percent of Table 2. If agencies size cushions that way, the model’s numbers are wrong.
Most of the gap has identifiable causes, and the model can price some of them. Bayfront’s pool was small, mixed sectors from conventional power and water to mining and liquefied natural gas, included a quarter of projects still under construction, and, as a first issue, faced agencies with no record to rely on. Pool size alone matters: in a pool of 40 equal loans the near-AAA requirement rises from 4.8 to 6.0 percent at \(\rho = 0.10\) and from 7.7 to 8.5 percent at \(\rho = 0.20\); with 20 loans, to 7.0 and 10.0 percent (Table 6). Construction-phase loans, which default at speculative-grade rates (Moody’s Investors Service 2017), and mixed sectors raise both \(p\) and \(\rho\). The rest is the agencies’ margin for model error, which a new asset class should expect to pay until it has a record (Coval et al. 2009).
Even an agency-style cushion leaves most of the saving. Suppose the first pools must carry Bayfront’s 30 percent beneath the senior bond: a 10 percent first loss at 12 percent, a 20 percent mezzanine at 8 percent and a 70 percent senior bond at 5 percent. The pool then costs 6.6 percent, the operating cost of capital is 7.7 percent, and the LCOE is 5.35 cents per kilowatt-hour, 14 percent below single-stage finance at 10 percent (Table 6). The saving falls from 19 to 14 percent; it does not disappear, because the senior bond still funds most of the pool at a low yield. The 5 to 8 percent of Table 2 is the destination for a large, standard pool of operating plants with a track record, not the first issue.
2.Source/model.py).
| Case | Subordination under senior bond | Pool cost | LCOE (US c/kWh) | Change vs single-stage 10% |
|---|---|---|---|---|
| Large pool, base (ρ = 0.20) | 7.7% | 5.65% | 5.04 | −19% |
| Pool of 40 loans, ρ = 0.20 | 8.5% | — | — | — |
| Pool of 20 loans, ρ = 0.20 | 10.0% | — | — | — |
| Lower-middle-income stress (ρ = 0.20) | 15.3% | 6.06% | 5.17 | −17% |
| Agency-style, as Bayfront 2018 | 30% | 6.60% | 5.35 | −14% |
A second objection is that operating plants are already refinanced, so nothing is new. In mature markets they are, through bank refinancing, project bonds and listed holding companies. The objection is right about mechanism and wrong about scale: in most developing countries no rated, standard take-out exists, which is why developers price the construction premium into a tariff that lasts twenty-five years. A third objection is that development banks could lend at their own AAA cost directly. They could, but their balance sheets are limited, and a pool that sells 70 to 92 percent of its liabilities to private investors frees that capital for the construction stage, where supervision matters.
7 Where there is no contract: tiered bond guarantees
Transmission, storage and equipment factories have no power purchase agreement to guarantee. A transmission line earns a regulated charge on the balance sheet of the same utility whose weakness raised the cost of generation. The cost of that gap is visible. Vietnam added 16.5 gigawatts of solar in 2019–2020 and 4.1 gigawatts of wind, with 95 percent of the solar in southern provinces where the grid was weak; congestion followed, and about 364 gigawatt-hours of solar output was curtailed in 2020 alone (Ketelsen et al. 2023). South Africa’s sixth bid window, in 2022, sought 3,200 megawatts of wind and up to 1,000 megawatts of solar; it awarded 860 megawatts of solar and no wind, because the grid in the Eastern and Western Cape, where all the wind bids were, had no capacity left (Bellini 2022). Cheap generation buys nothing without wires.
The first choice is to create a contract where one can exist. Independent transmission projects, tendered to private owners and paid on the availability of the line, raised more than $24.5 billion of private investment in Brazil, Chile, Peru and India between 1998 and 2015 and added close to 100,000 kilometers of lines (World Bank 2017). Storage can be procured under capacity-and-availability contracts. Where that works, the asset enters the pool on the same terms as a solar plant. The rule follows: guarantee the contract where there is one, and guarantee the bond where there is not.
Where no contract can exist, a tiered bond guarantee takes its place. A regional or national clean energy system authority issues bonds to finance backbone transmission, storage or equipment manufacturing. Up to three loss-absorbing tiers stand behind the bondholders. The first tier is the government that regulates the power system, such as an Indian state or the national government of Mozambique. The second is the national government, where states regulate. The third is a donor-backed special purpose vehicle, funded by a consortium of highly rated governments or a multi-donor trust fund. Bondholders lose only if all three fail.
The tiers work only if their failures are not perfectly correlated, and they are correlated. Table 7 illustrates with stylized ten-year default probabilities of 15 percent for the first tier, 8 percent for the second and 0.2 percent for the third, linked by a Gaussian copula. If the tiers failed independently, the second tier would be called with 15 percent probability, the third with 1.2 percent, and bondholders would lose with probability 0.002 percent. With a correlation of 0.5 between tiers, the third tier is called with 3.6 percent probability and bondholders lose with 0.09 percent; at 0.8, 6.0 percent and 0.19 percent. A state government and its national government often fail together: at a correlation of 0.8, three-quarters of national failures in the example coincide with a state failure. The donor tier therefore does most of the work in the tail, and its contingent commitment must be sized for that.
2.Source/model.py).
| Correlation between tiers | Tier 2 called | Tier 3 (donor) called | Bondholders lose |
|---|---|---|---|
| 0.0 | 15.0% | 1.20% | 0.002% |
| 0.5 | 15.0% | 3.61% | 0.094% |
| 0.8 | 15.0% | 5.95% | 0.19% |
Conditionality is what makes the first two tiers worth having. Guarantees should be offered only to governments that adopt a negotiated set of reforms: the standard power purchase agreement for generation, a path to cost-reflective tariffs, a schedule for retiring coal plants and a workable process for connecting new projects. Conditions lower the probability that the first tier fails, which in Table 7 is what reduces the call on everyone else. They also give a reforming government something concrete in return for hard decisions. That is where this paper meets the incentive instruments of series 4: guarantee capacity earned by climate policy can stand behind the third tier (Stretton 2026d), and a sustainability-linked loan can make the reforms its indicators (Stretton 2026a).
8 Currency and domestic savings
A dollar senior bond moves currency risk to the host; a local-currency senior tranche keeps it out. If the standard power purchase agreement is denominated in dollars, the intermediary carries the mismatch between its dollar obligations and the local-currency tariffs it collects, and behind it the host government. That is original sin reproduced inside a power contract (Eichengreen et al. 2003). The companion paper sets out the choices for the contract: denominate in local currency, index only the imported share, decline the tariff over time, or hedge (Stretton 2026b).
The pool can issue the same senior claim in local currency. Where the contracts are in local currency, the pool issues a local-currency senior tranche with the same seniority and the same first-loss cushion beneath it. Domestic banks, pension funds and insurers can hold it as a high-grade, long-dated asset. In countries without a deep bond market, banks can sell the tranche as a fixed-term green savings certificate: a deposit-like instrument backed by operating plants, guaranteed contracts and a regional first-loss fund. It gives savers a safe asset their banking system often cannot supply, and gives clean power long-term money with no currency mismatch.
Local-currency tranches still carry host-country correlation, so they need thicker cushions or local guarantors. A pool of local-currency contracts cannot diversify across currencies without taking currency risk, so Proposition 3’s cross-country gain is not available to it. Its subordination should be sized at the single-country correlation of Table 5, or a local-currency guarantor can supply part of it. GuarantCo, part of the Private Infrastructure Development Group, is the model: it guarantees loans and bonds for infrastructure, typically in local currency, is rated A1 by Moody’s and AA− by Fitch, and its parent is funded by six governments (Private Infrastructure Development Group 2025).
Dollar and local tranches can sit side by side. A pool can issue a dollar senior bond against the hard-currency share of its contracts and a local-currency tranche against the rest, so that neither the pool nor the host takes an open currency position. The currency mix of the liabilities should match the currency mix of the contracts (Stretton 2026g, ch. 10).
9 Precedents
Every element of the structure has been used; they have not been used together for clean power at scale.
IFC’s Managed Co-Lending Portfolio Program shows that institutions will buy a development bank’s credit selection in bulk. The program began in 2013 with $3 billion from the People’s Bank of China, allocated alongside IFC’s own loans, and IFC reports that it has since mobilized more than $19 billion from 18 partners (International Finance Corporation 2016, 2026). Its infrastructure arm, launched in 2016 with a $5 billion target and $500 million from Allianz, has IFC provide a limited first-loss guarantee, supported by the Swedish International Development Cooperation Agency (International Finance Corporation 2016). That is a first-loss tranche, a donor co-guarantee and a senior investor in one structure, applied to loans rather than securities.
Climate Investor One builds the two-stage logic into one facility. Managed by Climate Fund Managers, it combines a development fund, a construction equity fund and a planned refinancing fund, so that a project moves from development to construction to long-term debt within one platform. The development and construction equity funds closed at a combined $850 million in 2019; the refinancing fund was to be raised later (FMO 2019). The refinancing stage is the least developed, which is the gap the pooled refinancing in this paper fills.
Bayfront shows that pools of Asian infrastructure loans can carry a AAA senior tranche, after several issues. The 2018 transaction is described in Section 6. By September 2026 the program had completed nine transactions; the ninth, of $802 million, carried Class A notes rated Aaa by Moody’s and AAA by Fitch, with Class B rated Aa2, Class C Baa3 and an unrated mezzanine (Latham & Watkins 2026). Bayfront pools are diversified across countries and sectors, which is the condition of Proposition 3, and its sponsor holds the first loss, which is the role this paper gives the Climate Investment Trust’s regional funds.
Yieldcos show what goes wrong when operating-asset vehicles fund growth with their own share price. US yieldcos of 2013–2016 bought operating renewable plants from their sponsors and paid out the cash flows as dividends, promising dividend growth funded by new share issues. When the share prices fell, the cycle broke, and SunEdison, the sponsor of TerraForm Power and TerraForm Global, filed for bankruptcy in 2016 (Utility Dive 2016). The lesson for this paper’s pools is to fund operating assets with long-term rated debt and patient first-loss capital, not with a growth story, and to keep the pool legally separate from any developer.
India has built the domestic institutions for both stages. The Indian Renewable Energy Development Agency, a state-owned lender founded in 1987 and listed in 2023, finances renewable projects (Indian Renewable Energy Development Agency 2025). The National Bank for Financing Infrastructure and Development, created by statute in 2021, is regulated by the Reserve Bank of India as an all-India financial institution for long-term infrastructure finance (National Bank for Financing Infrastructure and Development 2025; Reserve Bank of India 2022). Together with the Solar Energy Corporation of India as payment intermediary (Stretton 2026b), India has the pieces for a domestic two-stage system: a construction and development lender, a long-term refinancing institution and a central buyer. What it lacks is the standard pooled security that would let domestic pension funds and insurers hold the refinanced assets directly.
Future-flow securitization shows that structure can lift paper above the sovereign ceiling. Developing-country issuers have long raised money above their sovereign rating against export receivables or remittances routed through offshore accounts (Ketkar and Ratha 2001). The synthetic sovereign bond applies the same principle to contracted power payments, with the added support of first-loss capital and a highly rated co-guarantor.
10 Risks
The main risk is a correlated host-sovereign shock, and it does not diversify within a country. A currency collapse or a fiscal crisis hits every distribution company, the subnational governments behind them and the national treasury at once. The guarantee waterfall behind the intermediary is then tested at every layer together. Time and Chance works through such a case: in a $100 billion guaranteed portfolio with a 5 percent equity buffer, a stress in which 15 percent of offtakers fall into arrears together and the currency component of the affected contracts loses a quarter of its value causes losses of about $15 billion, of which the buffer absorbs $5 billion and the highly rated guarantor $10 billion, with recovery rights on the sovereign ledgers (Stretton 2026g, ch. 14). Proposition 3 is the defense: regional pools under a regional intermediary turn a host-country factor into a diversifiable one. Single-country pools in large markets need the thicker cushions of Table 5’ first column.
Correlation is the parameter most likely to be wrong, and the senior rating is most sensitive to it. The lesson of 2007–09 is that senior tranches concentrate systematic risk and that ratings built on underestimated correlation fail together (Coval et al. 2009). Table 2 shows the sensitivity: moving from \(\rho = 0.10\) to \(0.20\) raises the near-AAA requirement by 60 percent. Sponsors should size first loss at the upper end of plausible correlation, publish their parameters, and keep the structure simple: one asset type, one contract, no re-securitization of tranches.
First-loss capital priced too cheaply subsidizes lenders and invites moral hazard. A first-loss provider that charges less than the risk it absorbs transfers value to bondholders who would have lent anyway, and a developer who knows its plant will be refinanced regardless has less reason to build it well. Two rules limit this. The pool should buy only plants that meet published technical and performance criteria after a period of operation, so construction quality is tested before the take-out. And the first-loss price should be explicit and published, so any subsidy is visible (Stretton 2026e).
The host government’s exposure is smaller, contingent and contracted; it is not zero. The structure adds no direct debt to the host’s balance sheet, but the guarantee waterfall behind the intermediary includes the national government, and the tiered bond guarantee puts the regulating and national governments in the first two tiers. These are contingent liabilities: obligations that fall due only if a specified event occurs. Most of them crystallize only if the government’s own utility stops paying or its own policy reverses. A liability the government controls differs from one it is merely exposed to, and debt sustainability frameworks should record both and distinguish them. Claims that such structures leave public finances untouched should not be made.
Rating agencies and regulators may not treat the structure as designed. Agencies may cap the senior bond’s rating near the host sovereign’s because of transfer and convertibility risk; sovereign ratings still weigh on the ratings of issuers in the same country, most where capital controls and political risk are high (Borensztein et al. 2013). They may not give full credit to a multi-sovereign co-guarantee that is several rather than joint, and may treat a pool of one asset class as concentrated. The remedies are known but cost money: offshore payment accounts, political risk insurance on transfer, joint guarantees with a single highly rated agent, and engagement with agencies before the first issue. Bayfront’s ratings on cross-country infrastructure pools show that a top rating is attainable (Latham & Watkins 2026); it has not yet been achieved on pools exposed mainly to low-income host countries.
Recycling depends on a market that the structure must first create. The first-loss provider recycles capital only if it can sell seasoned positions. Until a secondary market exists, it holds to maturity and supports a fixed stock of plants rather than a flow. Development finance institutions can bridge this by committing to buy first-loss positions in later pools.
11 Policy implications
Payment intermediaries should write a contingent power purchase agreement and a standard take-out into every auction. The contingent contract lets construction lenders lend against a known buyer, and a published refinancing route lets developers bid on the refinanced cost (Proposition 1(c)). The cost is legal drafting and a commitment the intermediary already intends to make. The design fails if the intermediary’s own payment is not credible, which is the subject of the companion paper (Stretton 2026b).
Development banks should sponsor regional pools of operating clean power assets, with explicit first-loss sizing. A pool spread across ten host countries, under one standard contract, needs about 40 percent less subordination than a single-country pool (Table 5). Sponsors should size first loss with a published model, at the upper end of plausible correlation and the lower end of plausible recovery, correct it for the number of plants in the pool, and disclose it. They should expect the first issues to carry agency-style cushions (Section 6) and to thin them as a record builds. The cost is the first-loss capital and the analytical work of standardization. The recommendation fails if contracts stay bespoke, because then the pool cannot be rated as diversified.
The Climate Investment Trust’s regional funds should hold the first-loss tranches. At scale, the first loss on clean power pools in emerging and developing economies is tens of billions of dollars over a decade. A regional fund that also co-invests at the development stage knows the failure modes of the plants it later insures, which is the information needed to price first loss (Stretton 2026e).
Highly rated sovereigns should co-guarantee the mezzanine layer instead of funding it. A guarantee of the layer between first loss and the senior attachment costs its expected loss, about 0.13 percent of the guaranteed amount a year in the base case, plus a reserve against the correlated tail. It delivers the same senior rating as funded mezzanine. Guarantors should hold explicit reserves and count the commitment in their own accounts.
Countries should finance grids through tiered, conditional bond guarantees, and contract the wire where they can. Independent transmission concessions paid on availability should come first; tiered bond guarantees should cover backbone lines and storage that cannot be contracted. Guarantees should be conditional on the standard power purchase agreement, a path to cost-reflective tariffs and a coal retirement schedule. Donors should size the last tier for correlated failure of the first two (Table 7).
Central banks and regulators should make the local-currency senior tranche an eligible, low-risk asset. Domestic pension funds, insurers and banks should be allowed to hold it with capital treatment matching its structure, and, where prudent, central banks should accept it as collateral. The cost is regulatory work; the risk is that a badly sized pool earns a treatment it does not deserve, which is why sizing should be public.
12 Conclusion
Once a payment intermediary has removed payment risk, the main remaining cost of clean power finance in developing countries is the way the projects are packaged. Splitting finance at commissioning, refinancing operating plants’ senior debt into pools under one standard contract and tranching the pools lets 70 to 92 percent of the debt come from senior bonds priced near developed-sovereign levels, and cuts the price of solar power by 14 to 19 percent in a stylized calibration. The first loss needed is small in a large, standard pool but highly sensitive to correlation and pool size, and the host sovereign is the main source of correlation; regional pools under one contract remove most of it. The main limitation is that default, recovery and correlation parameters for operating plants in low-income host countries are thin, and the senior rating depends on them. The next step is to calibrate the model to the loan-level default and recovery data that development finance institutions now publish, and to design a first regional pool with a sponsor, a first-loss provider and a guarantor willing to publish their numbers.
Downloads
References
Appendix A. Proofs
Proposition 1. (a) Two-stage LCOE minus single-stage LCOE is \(C[(1+r_c)^{B/2}\mathrm{CRF}(r_o,T) - (1+r_1)^{B/2}\mathrm{CRF}(r_1,T)]/E\), which is negative exactly under the stated inequality. With \(r_c = r_1\) it reduces to \(\mathrm{CRF}(r_o,T) < \mathrm{CRF}(r_1,T)\). \(\mathrm{CRF}(r,T)\) is strictly increasing in \(r\) for \(T > 1\): it equals the level payment per dollar on a \(T\)-year annuity, and the present value of a fixed payment stream strictly falls as \(r\) rises. So the inequality holds if and only if \(r_o < r_1\). (b) Differentiating the LCOE, \(\partial/\partial r_o = C(1+r_c)^{B/2}\mathrm{CRF}'(r_o,T)/E\) and \(\partial/\partial r_c = C(B/2)(1+r_c)^{B/2-1}\mathrm{CRF}(r_o,T)/E\). Their ratio is \(\frac{2(1+r_c)}{B}\cdot\frac{\mathrm{CRF}'(r_o)}{\mathrm{CRF}(r_o)}\). Numerically, with \(r_c = 12\) percent, \(B = 2\) and \(T = 25\), the ratio is 10.6 at \(r_o = 6\) percent, 9.6 at 8 percent and 8.6 at 10 percent. Since \(\partial r_o/\partial r_d = g\), the sensitivity to the refinanced debt rate is \(g\) times the sensitivity to \(r_o\). (c) In a competitive auction the winning tariff equals the bidder’s expected LCOE at the financing terms it can secure when it bids. If the refinancing rate is uncertain, the bidder prices the distribution of \(r_o\), and a risk-averse bidder adds a premium; if the take-out is committed at a known spread, the bid reflects it. This part is an argument about auction behavior, not a derivation.
Proposition 2. Conditional on \(Z = z\), defaults are independent with probability \(\pi(z) = \Phi\big((\Phi^{-1}(p) - \sqrt{\rho}z)/\sqrt{1-\rho}\big)\), so by the law of large numbers the pool loss converges to \(L(z) = \lambda\pi(z)\) (Vasicek 2002; Gordy 2003). \(L\) is strictly decreasing in \(z\), so \(\Pr[L > K] = \Pr[Z < L^{-1}(K)] = \Phi(L^{-1}(K))\). Setting this equal to \(\alpha\) gives \(L^{-1}(K^*) = \Phi^{-1}(\alpha) = -\Phi^{-1}(1-\alpha)\), so \(K^* = L(-\Phi^{-1}(1-\alpha))\), which is the stated formula. Because \(\Pr[L > K]\) is decreasing in \(K\), the senior tranche meets the target if and only if \(K \ge K^*\). \(K^*\) is proportional to \(\lambda\), increasing in \(p\) through \(\Phi^{-1}(p)\), and decreasing in \(\alpha\) through \(\Phi^{-1}(1-\alpha)\). For correlation, write \(a = \Phi^{-1}(p)\), \(b = \Phi^{-1}(1-\alpha)\) and \(f(\rho) = (a + \sqrt{\rho}b)(1-\rho)^{-1/2}\). Then \(f'(\rho) = \tfrac12(1-\rho)^{-3/2}\,(b/\sqrt{\rho} + a)\), which is positive if and only if \(b > -a\sqrt{\rho}\), that is, if and only if \(\alpha < \Phi(\sqrt{\rho}\,\Phi^{-1}(p))\). If \(\alpha \le p < 1/2\), then \(\Phi^{-1}(p) < 0\) and \(\sqrt{\rho}\Phi^{-1}(p) > \Phi^{-1}(p)\) for \(\rho < 1\), so \(\Phi(\sqrt{\rho}\Phi^{-1}(p)) > p \ge \alpha\) and the condition holds.
Proposition 3. For a plant in country \(c\), conditional on \((Z, Y_c)\) defaults are independent, so each country’s large sub-pool loses \(L_c = \lambda\Phi\big((\Phi^{-1}(p) - \sqrt{\rho_g}Z - \sqrt{\rho_c}Y_c)/\sqrt{1-\rho_g-\rho_c}\big)\). A single-country pool’s latent variables have pairwise correlation \(\rho_g + \rho_c\), so its loss is the one-factor loss with that correlation. Conditional on \(Z\), the \(L_c\) are independent, identically distributed and bounded, so by the strong law of large numbers \(L_N \to E[L_c \mid Z]\) almost surely. Using the identity \(E[\Phi(u + vY)] = \Phi(u/\sqrt{1+v^2})\) for standard normal \(Y\), with \(u = (\Phi^{-1}(p) - \sqrt{\rho_g}Z)/s\), \(v = -\sqrt{\rho_c}/s\) and \(s = \sqrt{1-\rho_g-\rho_c}\), gives \(E[L_c \mid Z] = \lambda\Phi\big((\Phi^{-1}(p) - \sqrt{\rho_g}Z)/\sqrt{1-\rho_g}\big)\): the one-factor loss with correlation \(\rho_g\). Almost-sure convergence implies convergence in distribution, and since the limit has a continuous, strictly increasing distribution function on \((0, \lambda)\), the \((1-\alpha)\)-quantiles converge, so the required subordination converges to \(K^*(p, \rho_g, \lambda, \alpha)\). By Proposition 2, \(K^*\) is strictly increasing in \(\rho\) when \(\alpha \le p < 1/2\), so \(K^*(p,\rho_g,\lambda,\alpha) < K^*(p,\rho_g+\rho_c,\lambda,\alpha)\) whenever \(\rho_c > 0\).
Appendix B. Code and parameters
All tables and figures are generated by 2.Source/model.py and 2.Source/make_wp_figures.py (Python 3 with NumPy, SciPy and Matplotlib). Running python3 model.py prints every table. Parameters: plant cost $800/kW, capacity factor 20 percent, operation and maintenance $12/kW/yr, 25-year operating life, two-year construction with even drawdown; senior debt 80 percent of capitalized cost in operation, project equity at 12 percent (sensitivity 10 and 14 percent); ten-year default probability of operating plants 5 percent (stress 10 percent); recovery 80 percent (stress 72 and 60 percent); correlations 0.05–0.30; senior targets 0.1, 0.5 and 1 percent over ten years; mezzanine attachment at a 5 percent ten-year default probability; stylized required returns of 12 percent (first loss), 8 percent (mezzanine) and 5 percent (senior), plus 0.3 percent a year of running costs. The two-factor model in Table 5 and the finite pools in Table 6 use 400,000 Monte Carlo draws with a fixed seed. The tiered guarantee in Table 7 uses a Gaussian copula with equal pairwise correlation.
Footnotes
The two-stage finance structure, the tiered bond guarantee and the regional equity funds developed here began in joint work with Jasper Zimmermann (“A Solar Economy Financing System”). The synthetic sovereign bond and the guarantee stack draw on the author’s book manuscript Time and Chance (Stretton 2026g). Errors are the author’s own.↩︎